Statistical Data Reduction and Analysis

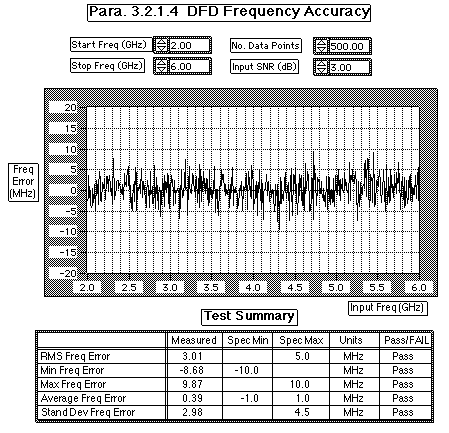
R. A. Wood Associates Software can save valuable test and debug time by analyzing and summarizing large quantities of data. This example shows the result of taking 500 frequency readings from a Digital Frequency Discriminator (DFD) under low signal to noise ratio conditions. The DFD frequency error is plotted on the graph vs input frequency. The statistics of the frequency error are evaluated in the Test Summary and compared against the specifications. The test operator obtains immediate feedback from the results of the measurements.