Overview

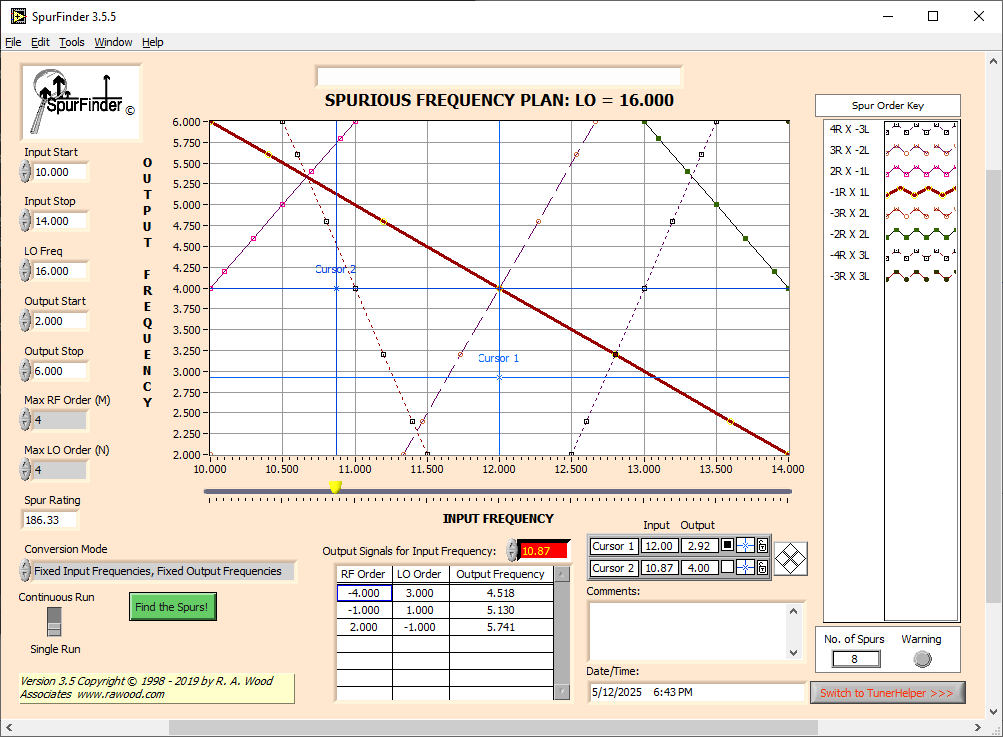
SpurFinder enables designers to evaluate various frequency conversion schemes before implementing them. The user simply enters an input frequency range, an output frequency range, and a fixed LO frequency. The program then displays a mixer spur chart that shows the output frequencies for all mixer spurious products up to the 20th order of M*RF and N*LO. The latest version includes a new "Slider Bar," which lets the user slide a cursor across the input frequency range. A table displays the output mixer spurious products and their frequencies in real time. Use this program to choose the conversion scheme (RF, LO and IF frequencies) with the best spurious performance. The program also provides a look at the pre-selection and post-selection filter rejection requirements for the conversion scheme.

  • Graphically displays the location of spurious products in a frequency conversion process.
  • Replaces the old "Mixer Spur" charts and nomographs
  • Works for up conversions and down conversions.
  • Evaluate your receiver or transmitter conversion scheme before implementation.
  • Optimize your conversion scheme for best spurious performance.
  • Analyze pre - selection and post - selection filter requirements based on spurious frequencies.
  • This program is a valuable and necessary tool for all receiver designers.
This trial version has all features of the full version except for the following limitations:
  • The Local Oscillator (LO) value is limited to 16.0 +/-0.25
The full version is available for purchase for $129.99 (US Dollars).

Screenshots:

Details

The SpurFinder program provides graphical information on the location of all spurious products in a frequency conversion process. The designer enters a defined INPUT FREQUENCY range, a defined OUTPUT FREQUENCY range, and a fixed LO FREQUENCY. The location of all spurious products up to "M" X RF and "N" X LO harmonics are displayed graphically. This program is a much improved tool from the old "Radar Handbook" spur charts, which are generic, normalized charts (sorry, Mr. Skolnik). These generic, normalized charts don't let you see the actual input and output frequencies to determine where the spurious frequencies are located.

The program can be used for either be mixer down conversion or up conversion processes. The program is very easy to use. The input parameters needed are:

  • Input Start Frequency
  • Input Stop Frequency
  • LO Frequency
  • Output Start Frequency
  • Output Stop Frequency
  • Max RF Order (M)
  • Max LO Order (N)

Input parameters are entered directly on the screen. Press the RUN button and the program will plot the spurious frequency locations. Each Spurious Product (±M X RF) + (±N X LO) is represented by a different line on the graph. The X and Y axis show the actual input and output frequencies (not normalized). The plots can be printed, and actual spurious information can be saved to a text file if needed.

If the application is a down conversion the input frequency or the "X-axis" would be the RF Input Frequency range. The "Y-axis," or output frequency range would be the IF frequency. If the application is an up conversion, the X-axis would be the lower IF frequency, and the Y-axis would correspond to the output RF frequency.

All plots created by this program can be printed. Once these spurious frequencies are plotted, mixer information can be looked up or measured to determine the relative amplitude levels of these spurious signals for each order of LO and RF harmonic. Once the spurious amplitude levels are determined, the preselection filtering requirements at the input to the mixer and the post-selection filter requirements at the output of the mixer can be determined. Actual filter rejection points can then be established and filter design can proceed from there.

There are many uses for this tool. For higher RF and microwave frequencies, various conversion schemes (different combinations of LO and IF frequencies) can be evaluated to determine which conversion scheme provides the best or optimum spurious responses. This can reduce cost in the receiver by reducing the requirements for the filters on each side of the mixer.

Current Program Features

You can select and view spurious products any order up to order 20R X 20L

3 Different Conversion Modes

  1. Fixed Input Frequencies, Fixed Output Frequencies
    • The input and output frequencies do not move as the LO frequency is adjusted
  2. Sliding Input Frequencies, Fixed Output Frequencies
    • Used for fixed output IF frequency range, such as a down conversion. As the LO is tuned, the input frequency range "slides", and the output frequency range stays fixed
  3. Fixed Input Frequencies, Sliding Output Frequencies
    • Use for fixed input frequency range, such as in a transmitter or Up Converter. As the LO is tuned, the input frequency range stays fixed, and the output frequency range "slides"

Capability to Load and Save SpurFinder Scenarios

  • SpurFinder can save scenarios (display parameters) to text files, and read the files into SpurFinder. This can save time in setting up various receiver or transmitter configurations

Continuous Run Capability

  • You can select a "Continuous Run" mode, where you can change the SpurFinder parameters and the spurious plots are updated automatically, great for scanning through many frequency conversions

Transfer SpurFinder information to TunerHelper

  • You can select the "Switch to TunerHelper" button and the program will open up TunerHelper (if available on your computer). The parameters in SpurFinder are automatically entered into TunerHelper. If you have mixer parameters defined in TunerHelper, you can view the level of spurious signals for the conversion scheme in SpurFinder.