SpurFinder enables designers to evaluate various frequency conversion schemes before implementing them. The user simply enters an input frequency range, an output frequency range, and a fixed LO frequency. The program then displays a mixer spur chart that shows the output frequencies for all mixer spurious products up to the 20th order of M*RF and N*LO. The latest version includes a new "Slider Bar," which lets the user slide a cursor across the input frequency range. A table displays the output mixer spurious products and their frequencies in real time. Use this program to choose the conversion scheme (RF, LO and IF frequencies) with the best spurious performance. The program also provides a look at the pre-selection and post selection filter rejection requirements for the conversion scheme.
- Graphically displays the location of spurious products in a frequency conversion process.
- Replaces the old "Mixer Spur" charts and nomographs
- Works for up conversions and down conversions.
- Evaluate your receiver or transmitter conversion scheme before implementation.
- Optimize your conversion scheme for best spurious performance.
- Analyze pre - selection and post - selection filter requirements based on spurious frequencies.
- This program is a valuable and necessary tool for all receiver designers.
- The Local Oscillator (LO) value is limited to 16.0 +/-0.25
Screenshots:
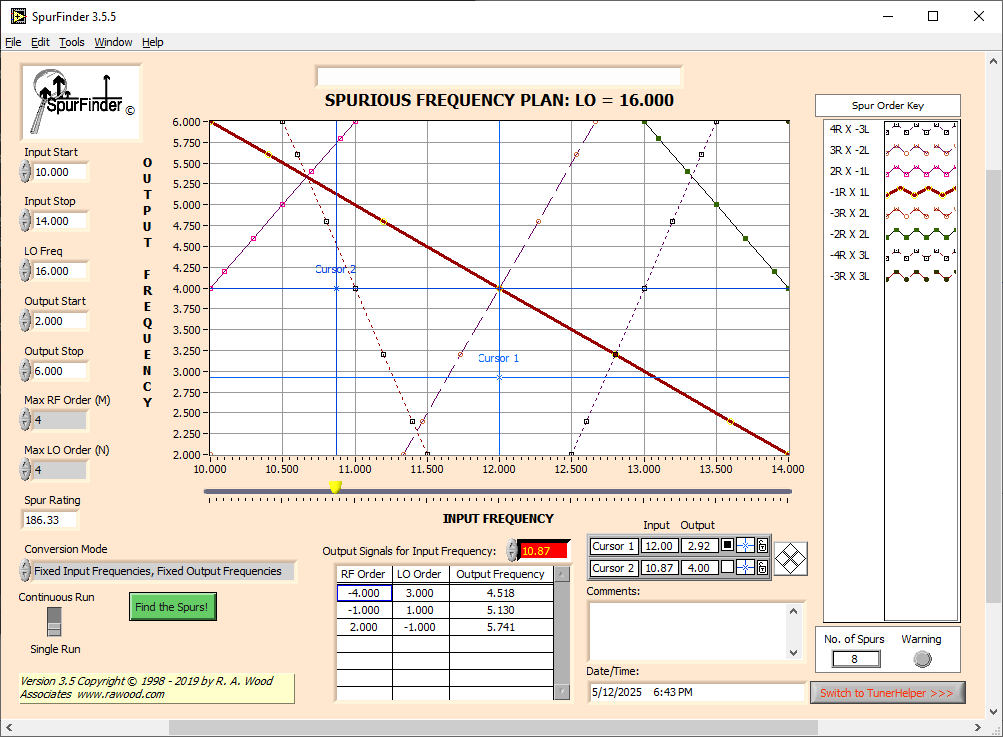
Main Panel
TunerHelper aids in the design of a receiver or transmitter frequency conversion scheme by providing a user friendly interface for analysis. Specify the input pre-selection filter requirements, the mixer spurious requirements, the leakage requirements, and the output post - selection filter requirements to view the signals and spurious products in your design. The program allows the user to determine all output signal and spurious products for any input frequency and amplitude. All filter and mixer parameters may be saved to files for use in other conversion schemes.
- Easy to use graphical interfaces display "spectrum analyzer" view of all signals and spurious products.
- Used to design and specify filters and mixers in a frequency conversion process.
- All parameters (eg. mixer spurious and isolations, filter rejections, etc.) are configurable.
- Works for up conversions and down conversions.
- Adjustable input pre-selection filters, mixers, and output post-selection filters.
- All parameters and scenarios may be saved to and loaded from data files.
- The Local Oscillator (LO) value is locked at 16.0 MHz
Screenshots:
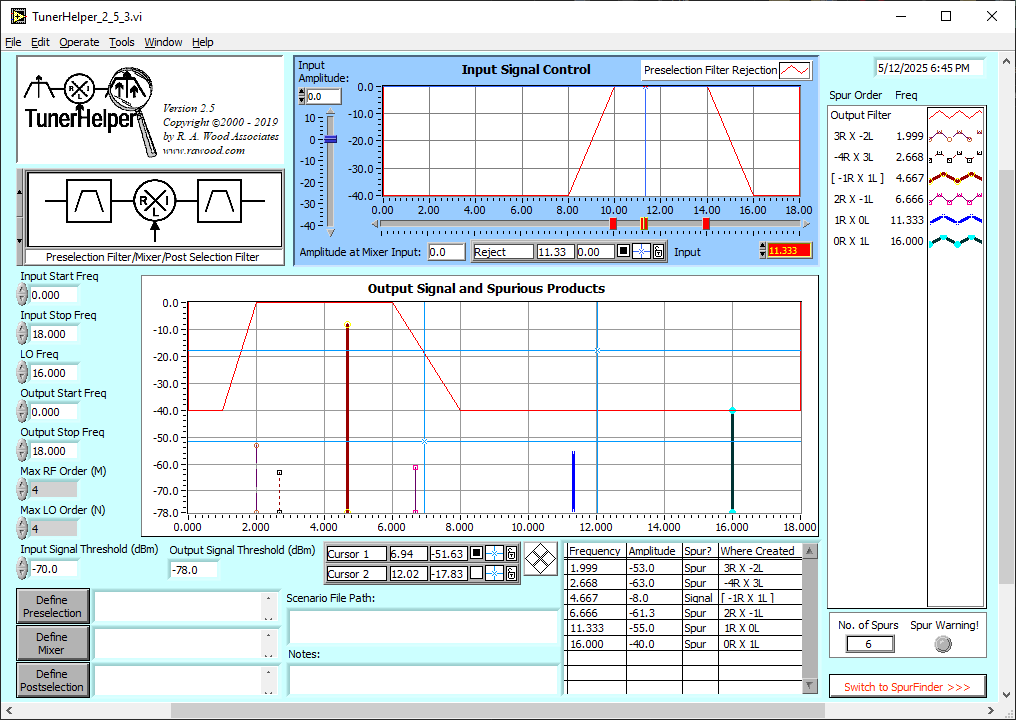
Main Panel
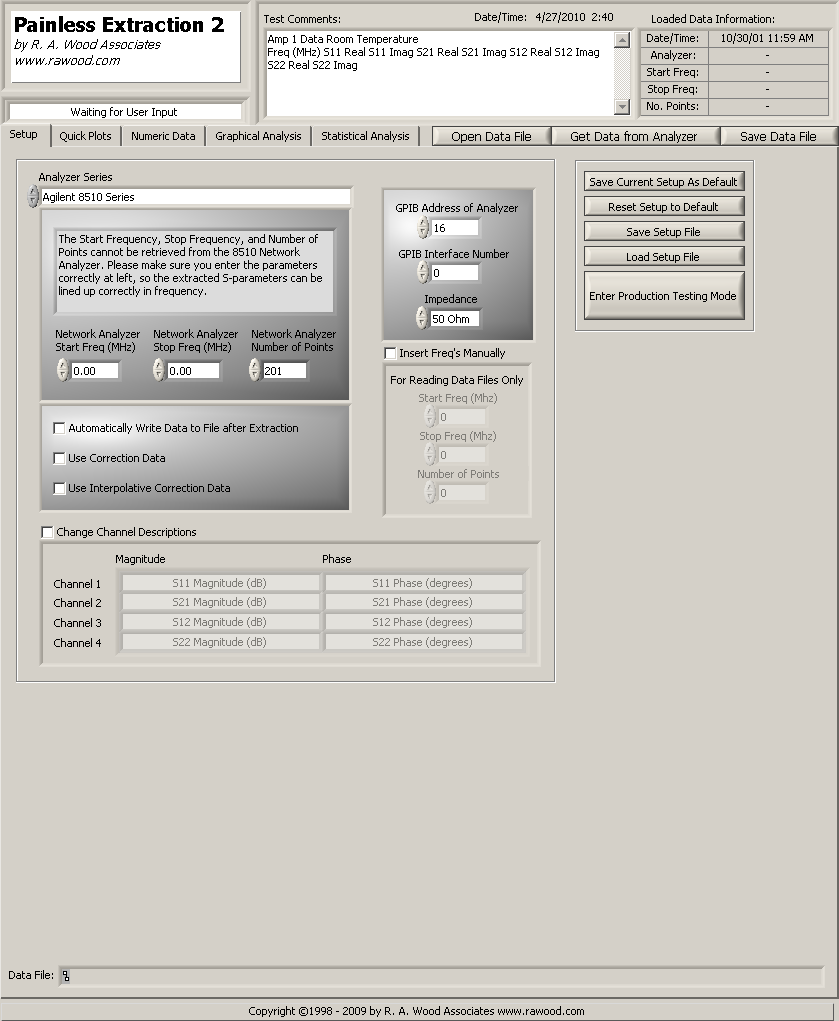
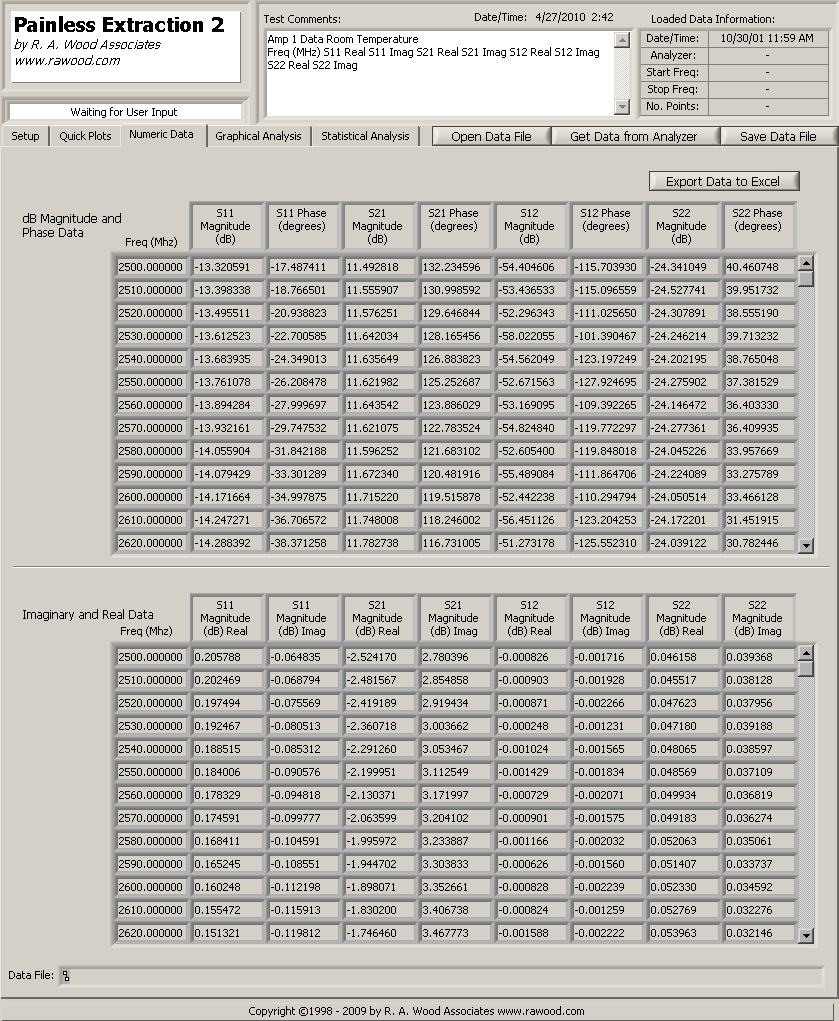
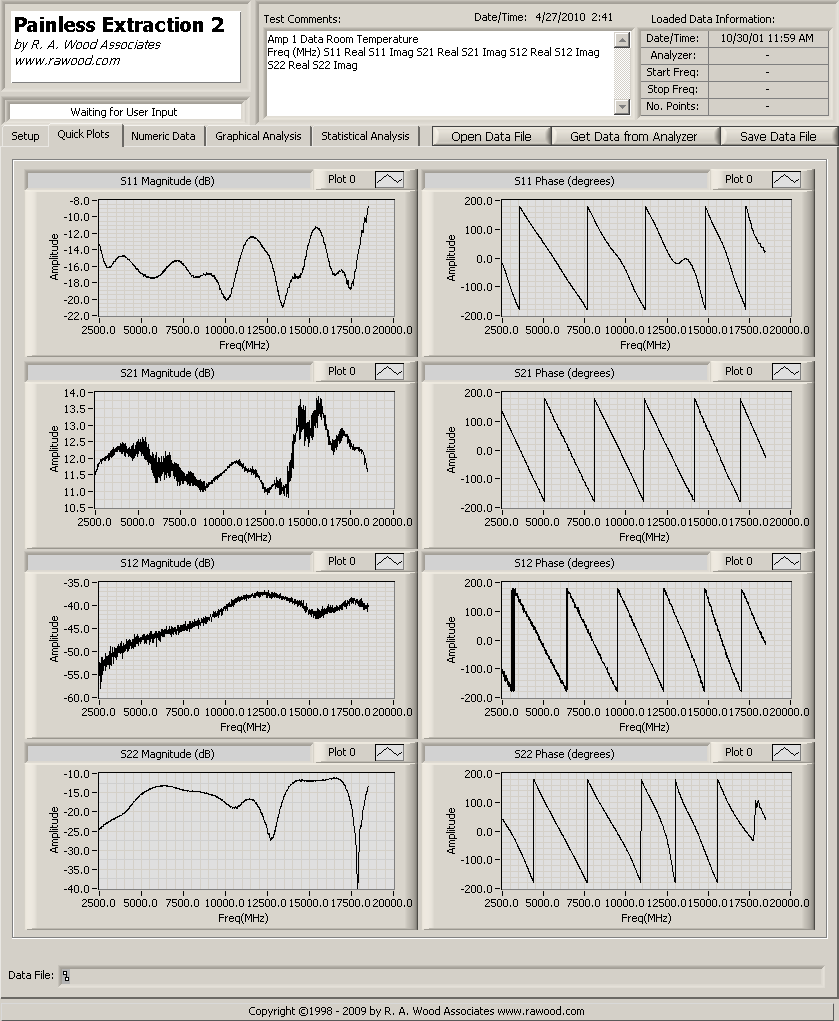
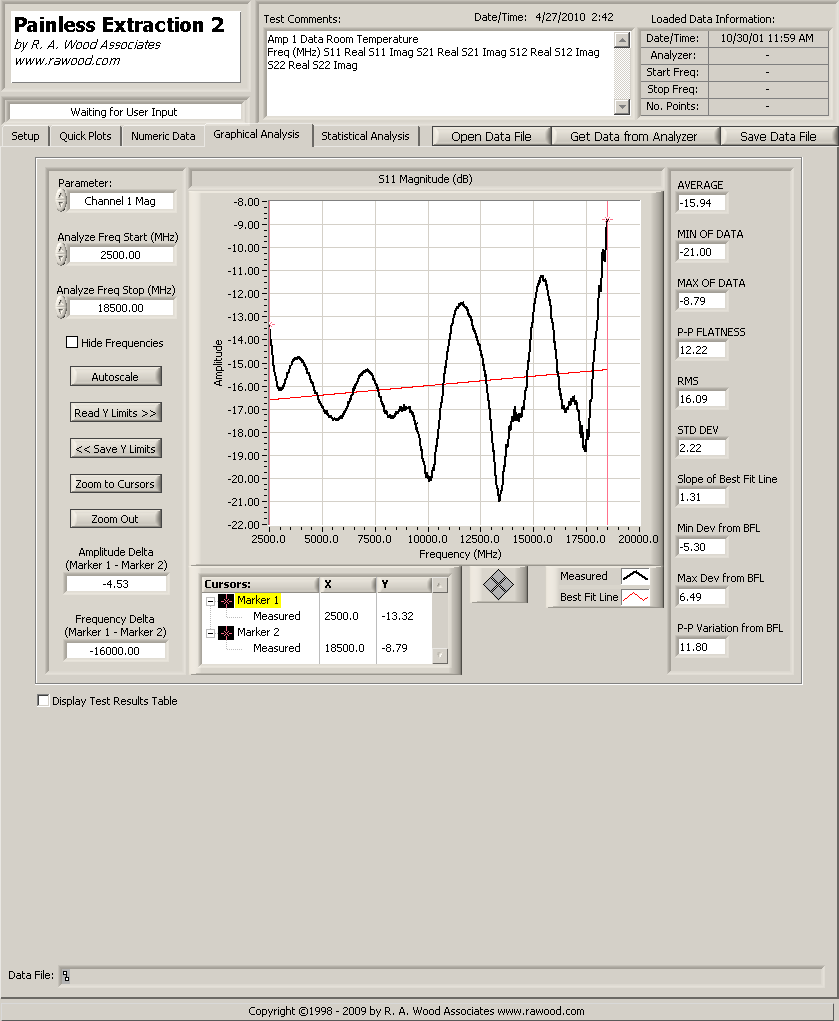
Painless Extraction is a comprehensive program that automates the extraction of data from Network Analyzers to PCs. This program will save extracted data to an S2P file and read existing S2P files for statistical analysis. Script files may be created or imported to perform quality assurance pass/fail testing. Data analysis is performed on the selected S-parameters providing a wide array of statistical information. The current program works for Agilent (HP) 8720, 8753, 8757, and 8510 models, but other network analyzers can be added (contact us for additional models).
- Retrieves S-parameters electronically from Network Analyzers (currently Agilent 8720, 8753, 8757, and 8510)
- S-parameters can be stored in S2P data files.
- S-parameters can be retrieved from S2P data files.
- Flexible plotting routines
- Data analysis of each S-parameter vs. frequency
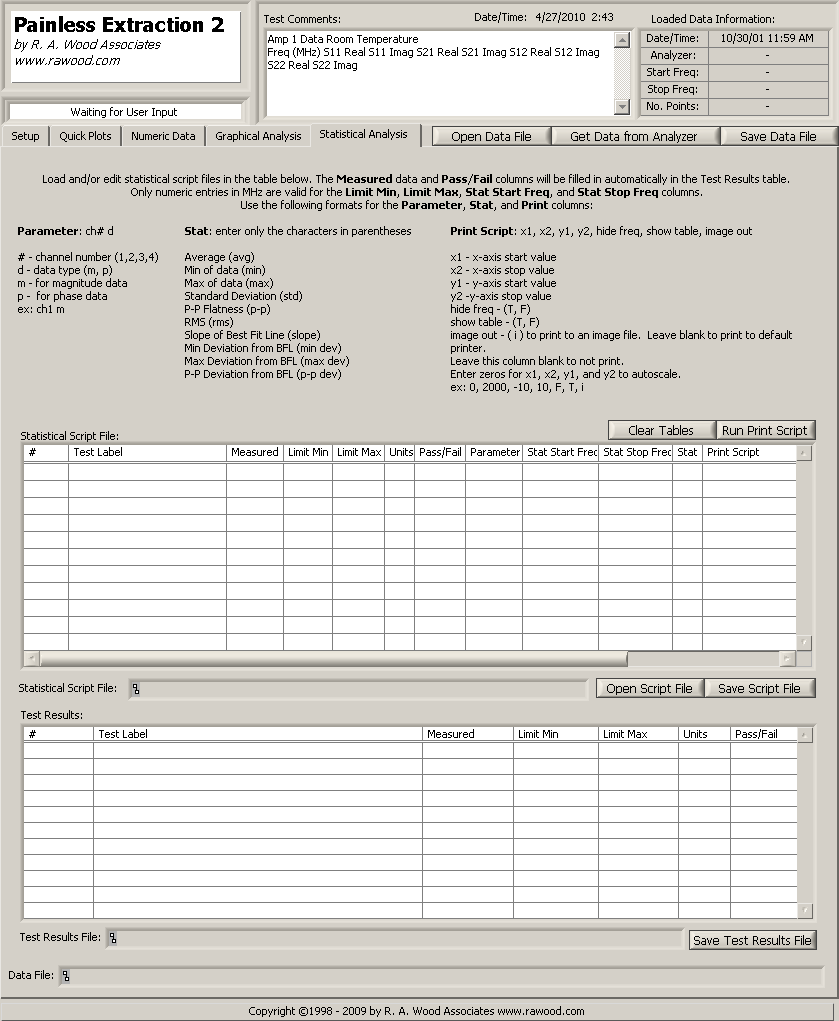
- Script files may be created, loaded, and saved to identify pass/fail points in the selected data.
- A Test Results file may be saved to summarize the outcome of the pass/fail script file test.
- A great way to view S2P Files!
- A must for anyone using a Network Analyzer!
- The capability to save data to files is disabled
- The analysis frequency range is limited to 2750 - 2950 MHz
Screenshots:
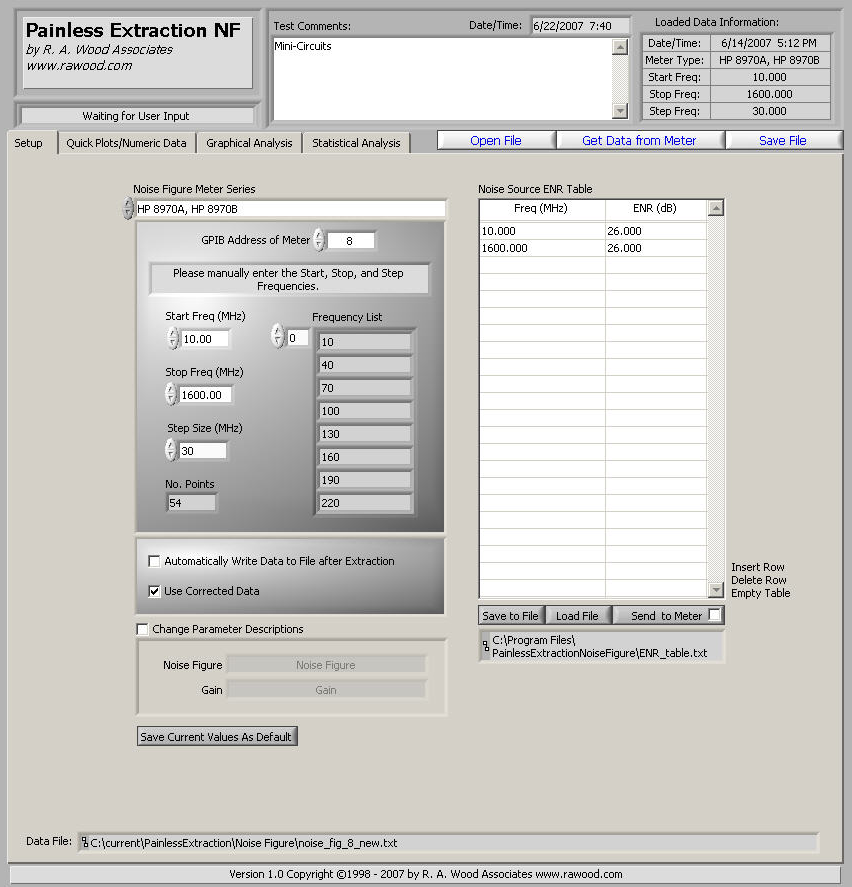
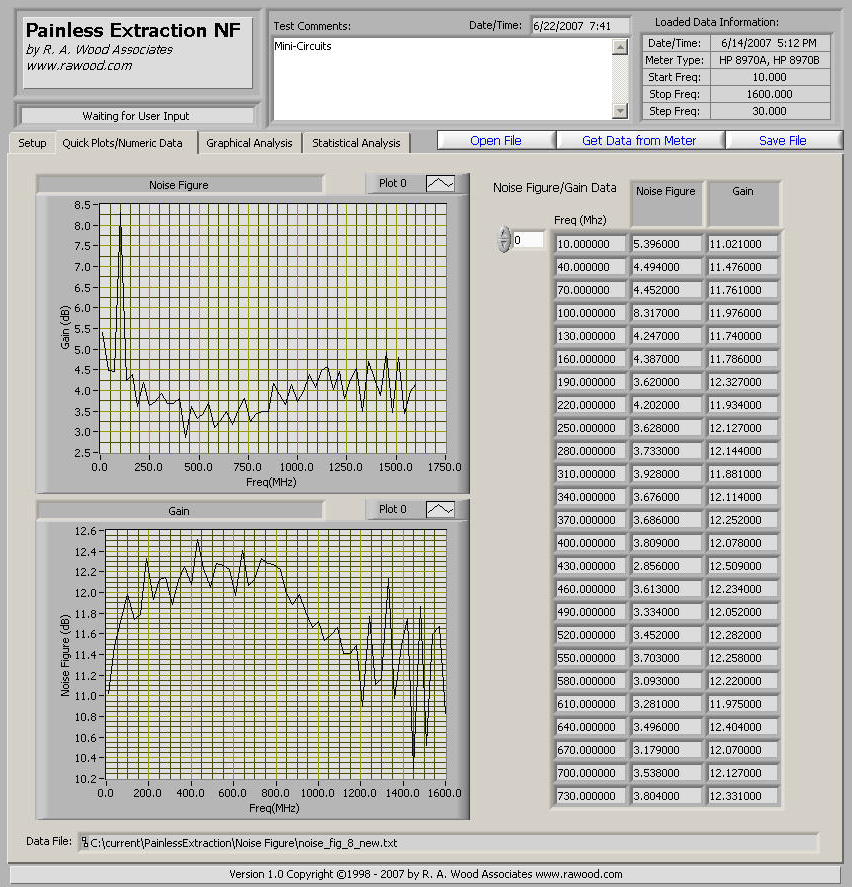
Painless Extraction Noise Figure allows for the extraction and analysis of noise figure and gain data from Noise Figure Meters. Data analysis is performed on both parameters to provide a wide array of statistical information. After data retrieval, the data may be saved to a file for future use. The program currently works with the HP 8970A and HP 8970B Noise Figure Meters (contact us for additional models).
- Retrieves noise figure and gain data via GPIB from Noise Figure Meters (HP 8970A, HP 8970B are currently supported)
- Input Start, Stop, and Step frequencies to extract data across a specific band
- A noise source ENR input table allows for ENR data to be sent to the meter.
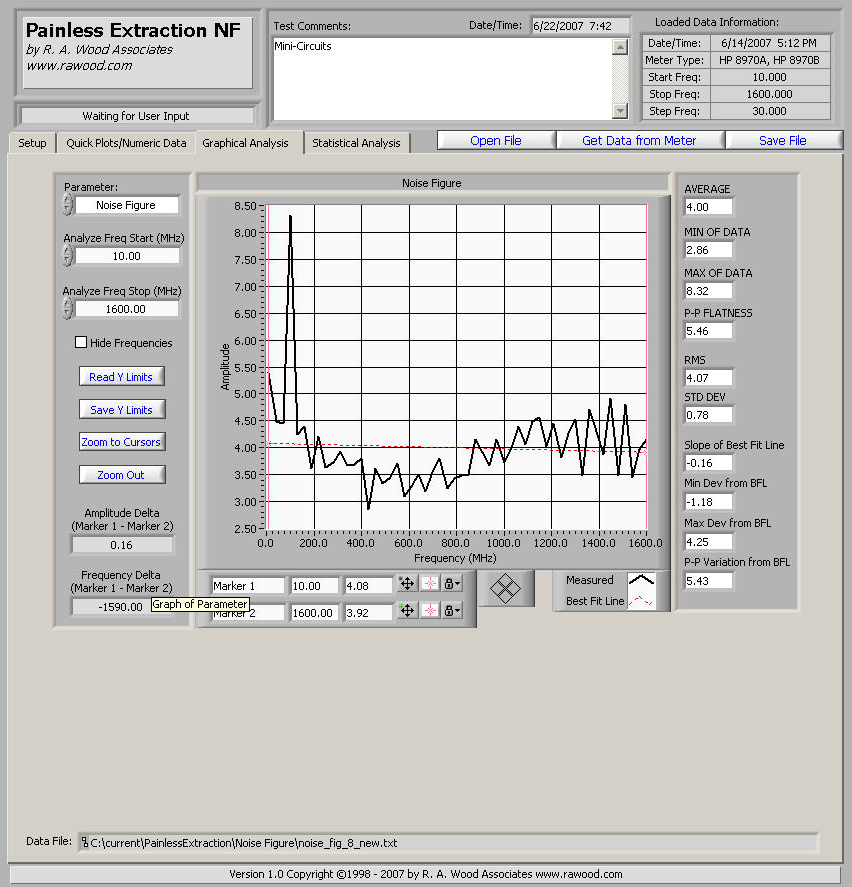
- View customizable noise figure vs frequency and gain vs frequency plots.
- Analyze detailed statistical parameters.
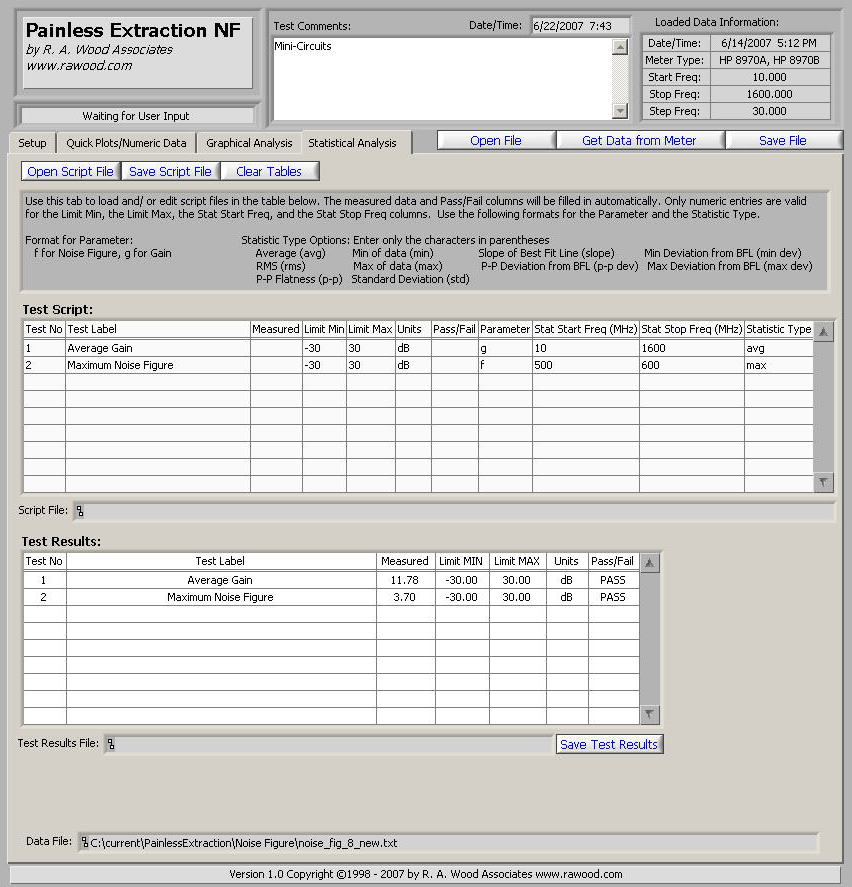
- Script files may be created, loaded, and saved to identify pass/fail points in the selected data.
- A Test Results file may be saved to summarize the outcome of the pass/fail script file test.
- Remove the hassle out of noise figure measurements!
- The capability to save data to files is disabled
- The analysis frequency range is limited to 225 - 250 MHz
Screenshots:
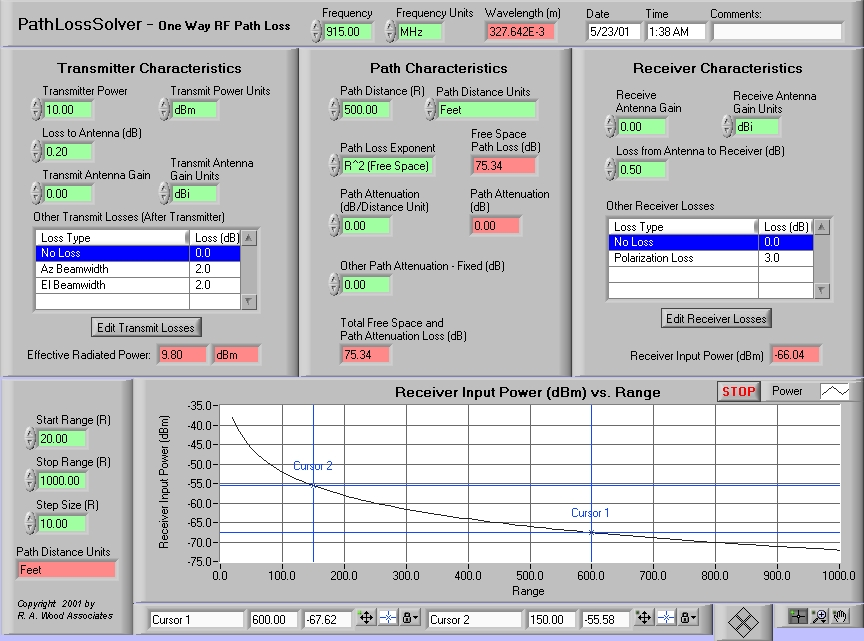
PathLossSolver calculates the one way RF path losses. This program provides a simple, easy to use interface to determine the Radio Frequency (RF) signal levels at a receiver at a given distance from an RF transmitter.
This program is very easy to use. Some of the highlights are:
- Calculates RF signal level at a range of distances from the transmitter.
- Antenna gains, transmitter losses and receiver losses can be incorporated into the calculations.
- Simple, intuitive, and easy to use interface
- Different units (km, miles, feet, etc) may be selected for distance and transmitter power.
- A list of additional losses may be created and included in the calculations.
- A graph and table of receiver power level vs. range is plotted.
- Parameters may be loaded from and saved to text files.
The program has three parts: Transmitter Characteristics, Path Characteristics, and Receiver Characteristics. Parameters can be modified in each of these parts to determine the RF signal level at the receiver input.
- The Frequency value is fixed at 915 MHz or 915 GHz
Screenshots:
Main Panel