


|
|
|
|
|||
|
|
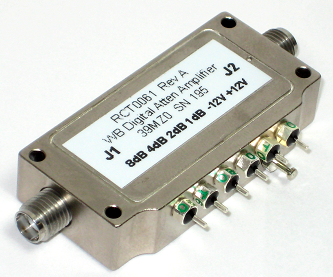
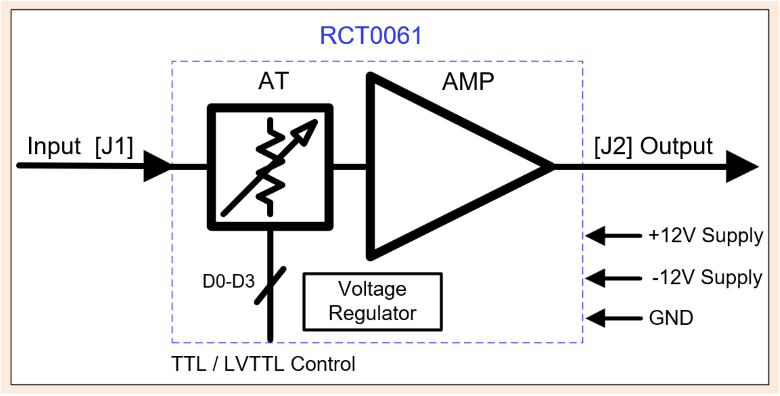
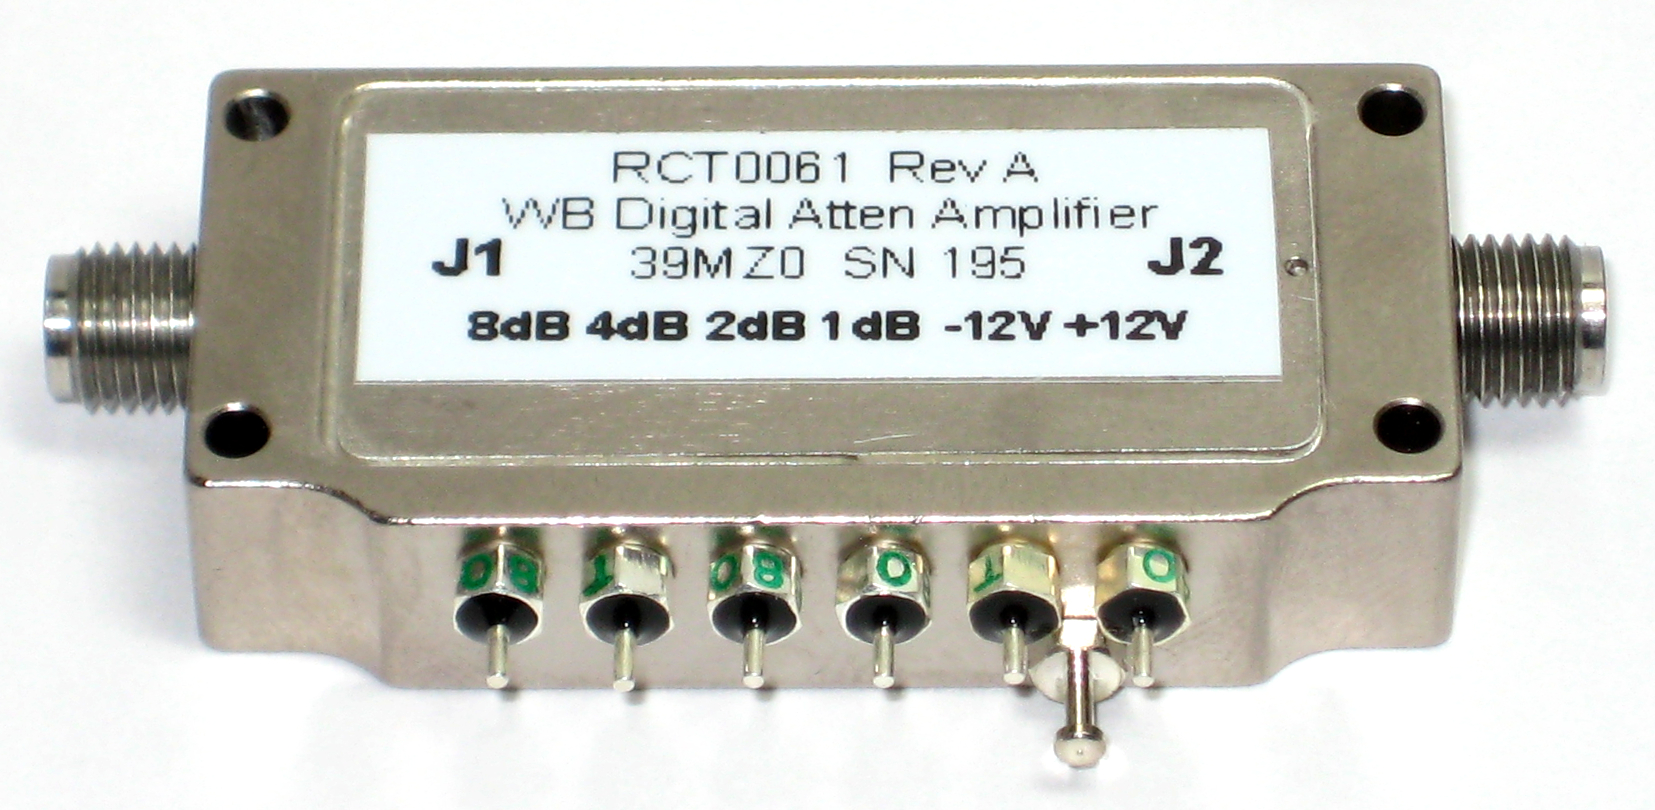
R. A. Wood Associates has designed and built a new wide-band digital attenuator amplifier (DAA), using surface mount technology. The DAA can be utilized across the frequency band: 0.5 - 18.0 GHz. This product is an ideal choice for electronic warfare (EW) applications in high dynamic range locations. This unit has good wide-band flatness, high dynamic range, and good noise figure for its high 1dB compression point. Performance in narrower bands is even better, as shown in the Specification Table with accompanying plots. To see digital attenuation accuracy data over various frequency bands, please see the Attenuation Table. We are keeping these built ahead to improve delivery time. If you are interested in pricing and delivery, please Contact Us.
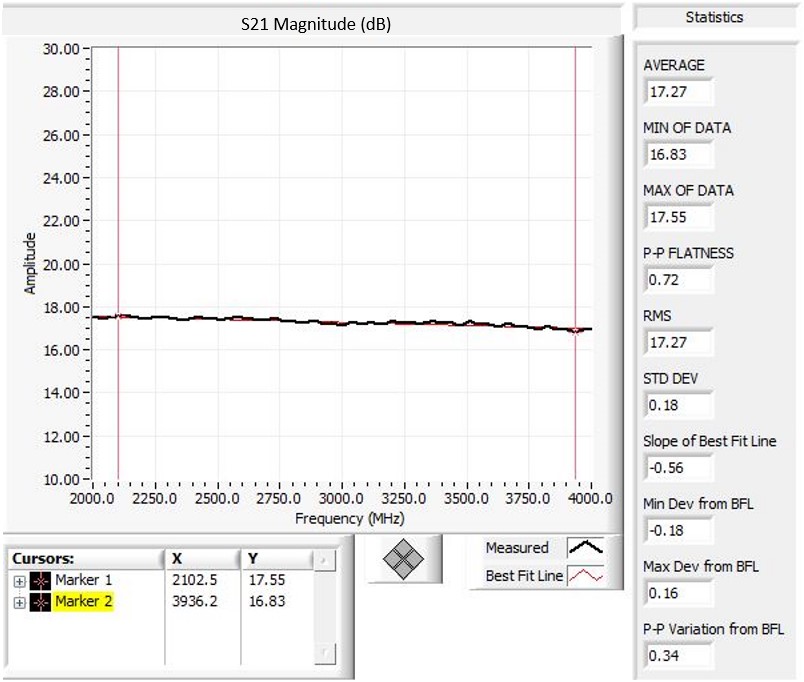
Wide-band performance of the DAA can be seen in the plots below. The plots display typical measured data for various parameters such as gain (S21), output 1dB compression point (P1dB), input return loss (S11) and output return loss (S22). The unit is designed to be supplied with +12V, and -12V on their respective pins. All data on this page was taken with the unit at these voltages. An internal, negative voltage regulator helps to provide noise suppression and a precise output signal. Typical current draw for the positive voltage is approximately 240mA, and typical current draw for the negative voltage is approximately 20mA. For the control pins, either state draws approximately 1µA, typically. See our Recommended Operating Conditions Table for more information. These DAA units can be built quickly with surface mount assembly.
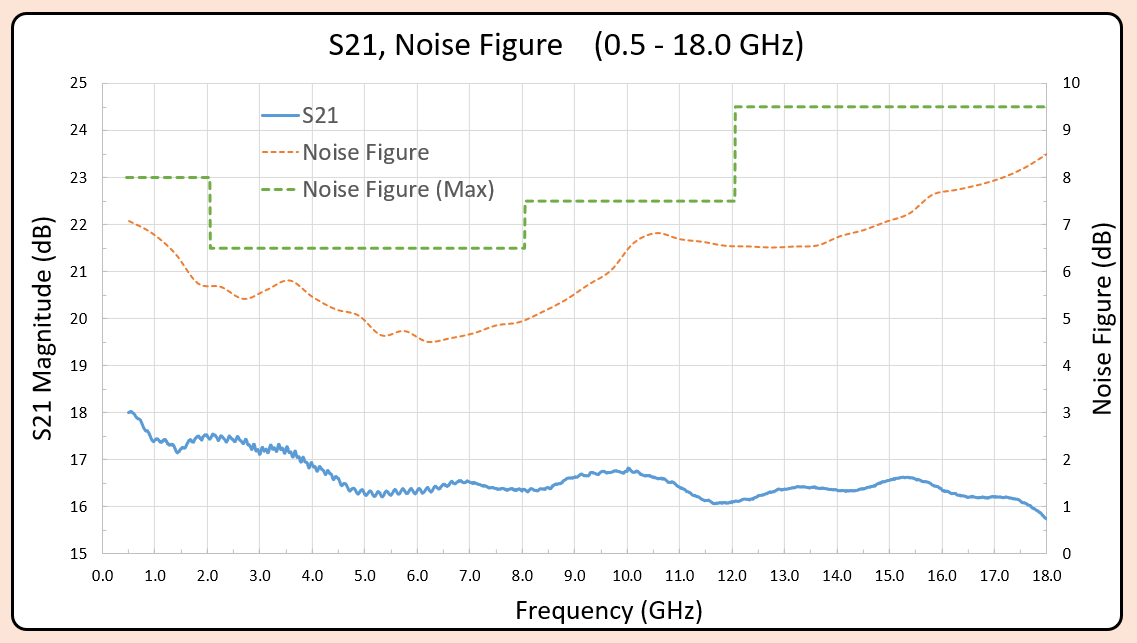
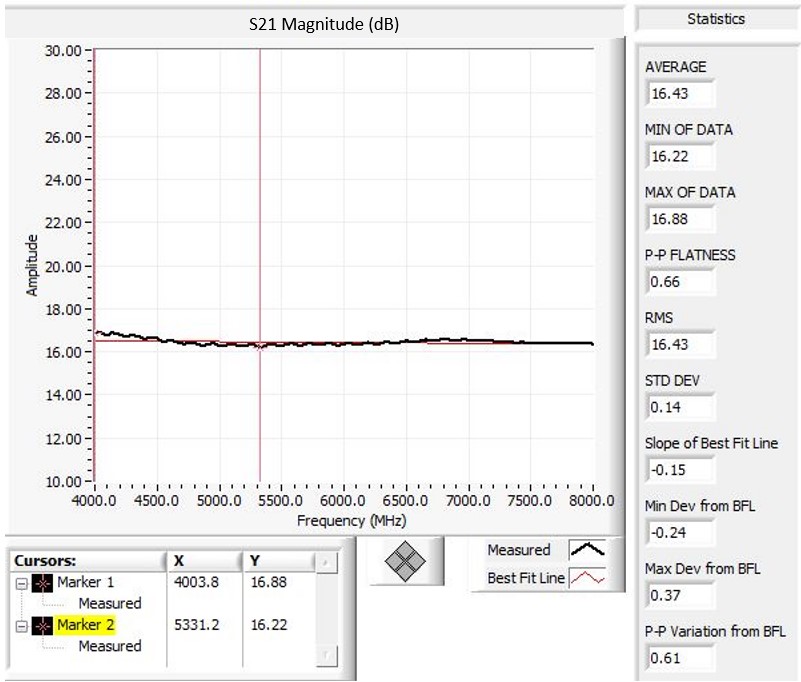
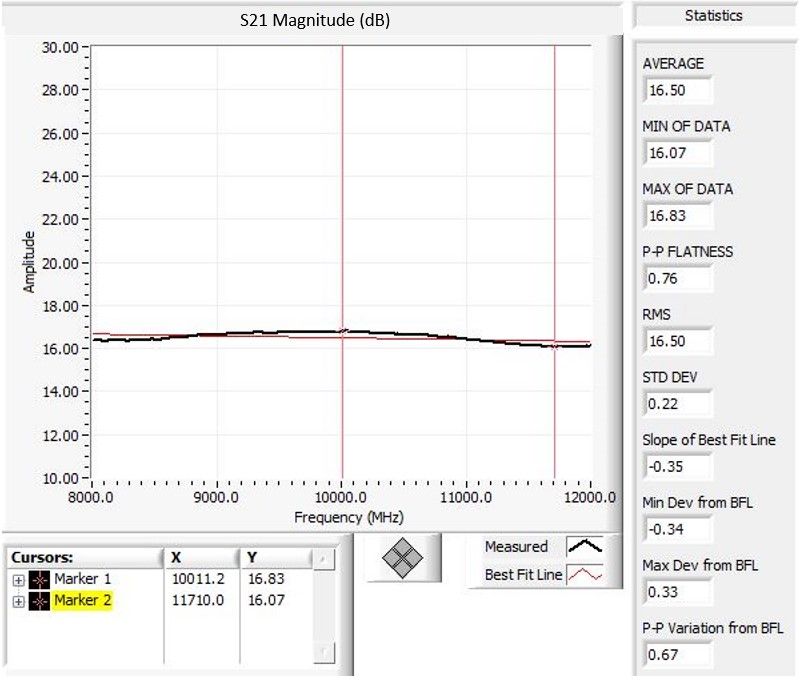
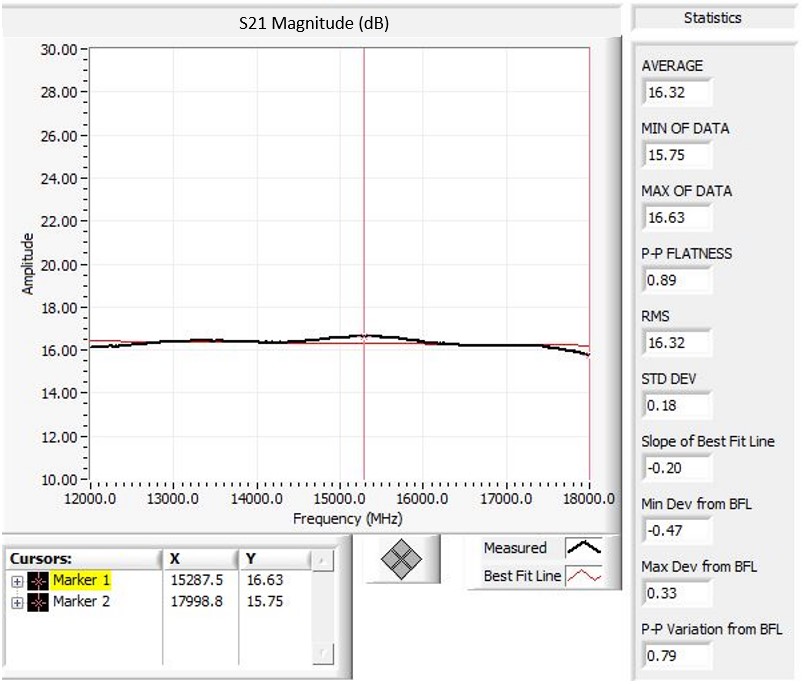
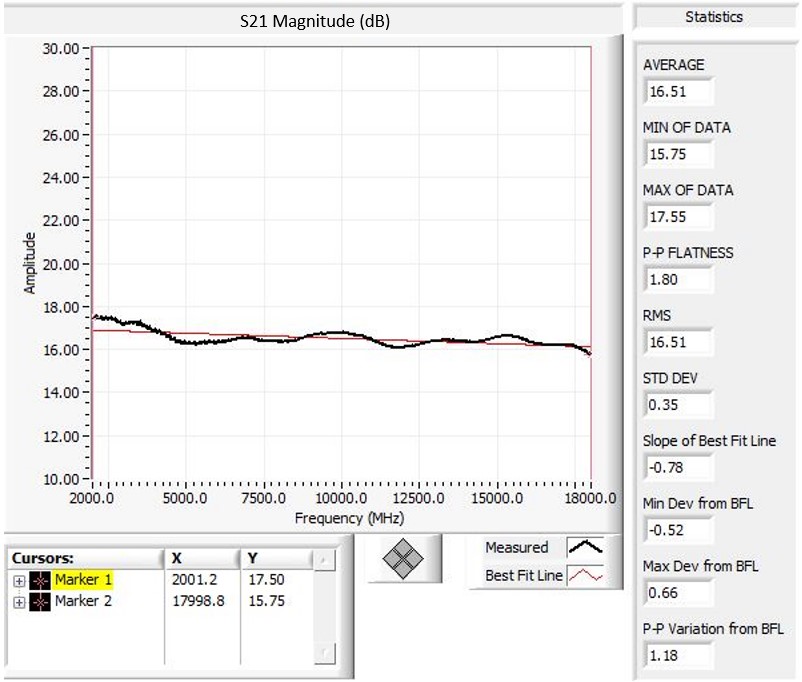
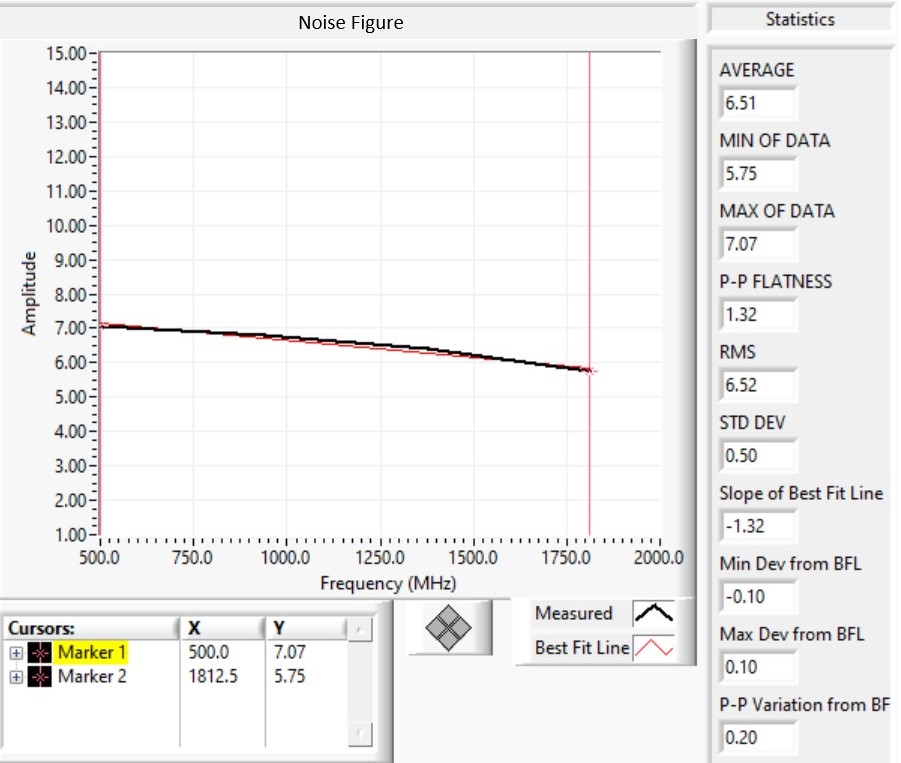
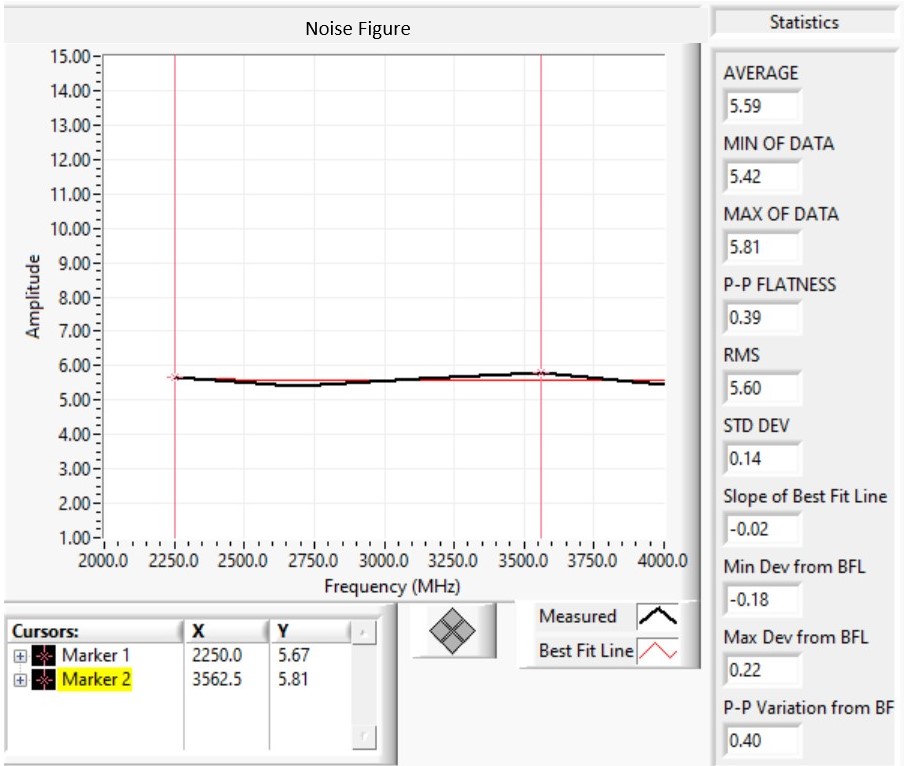
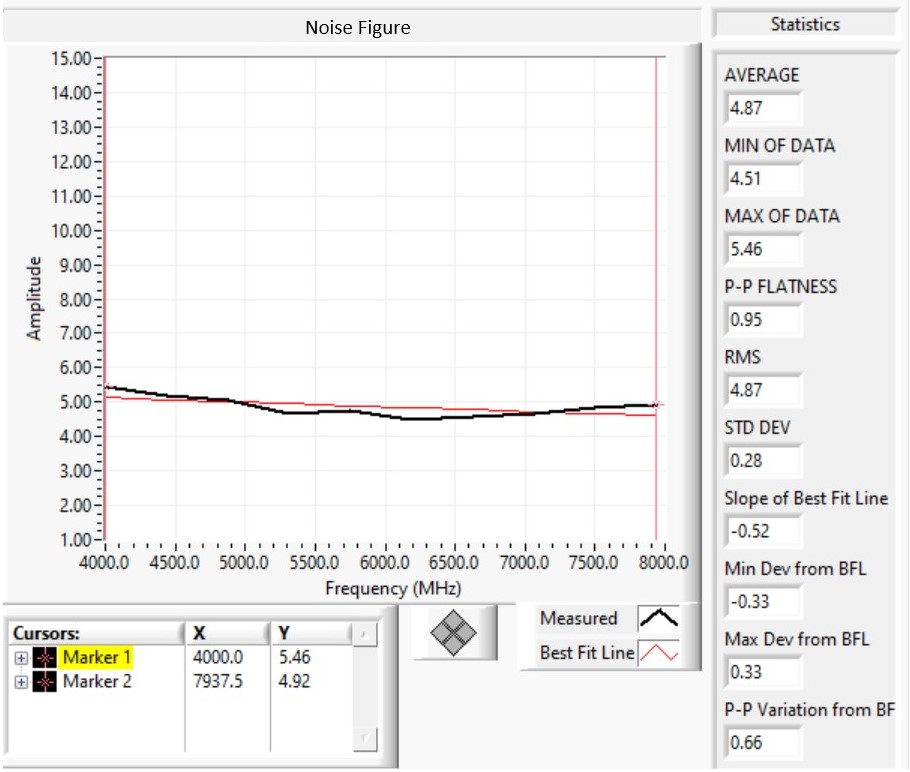
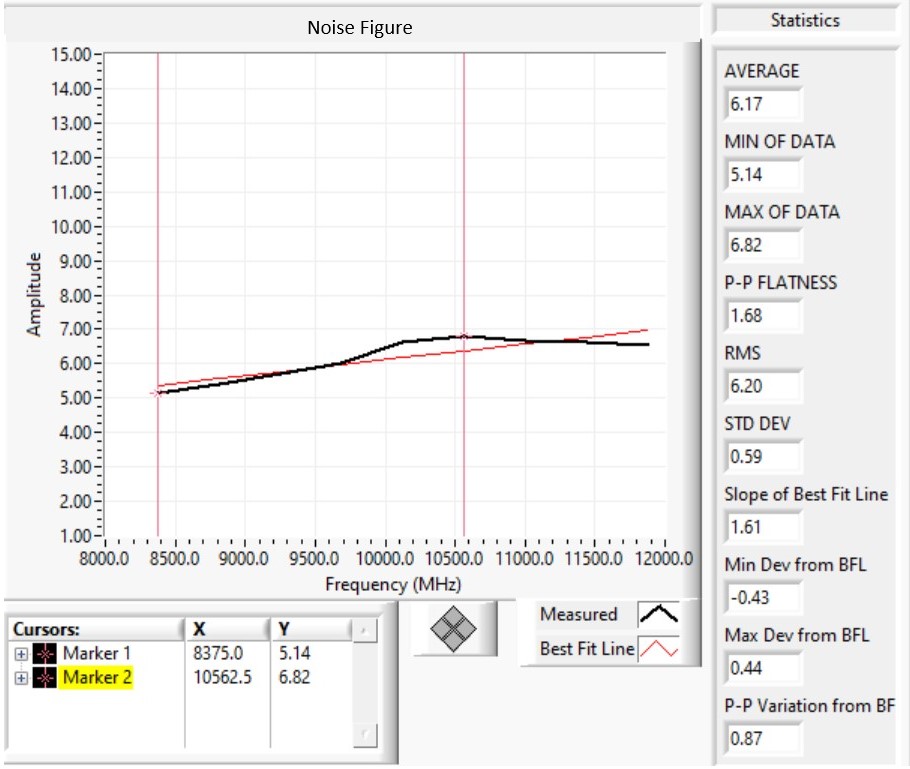
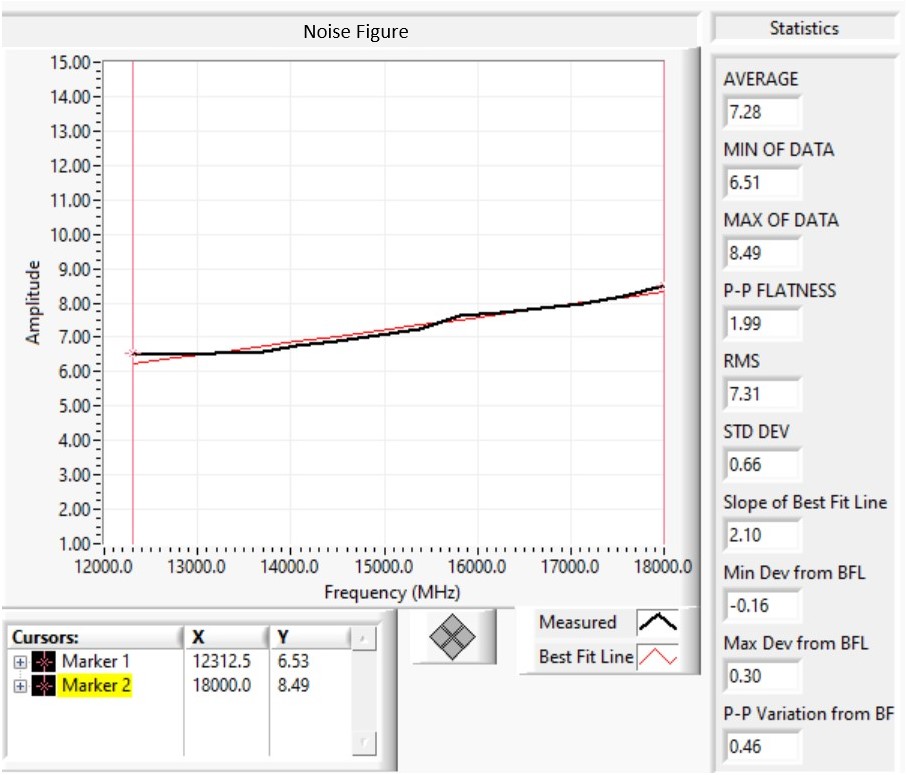
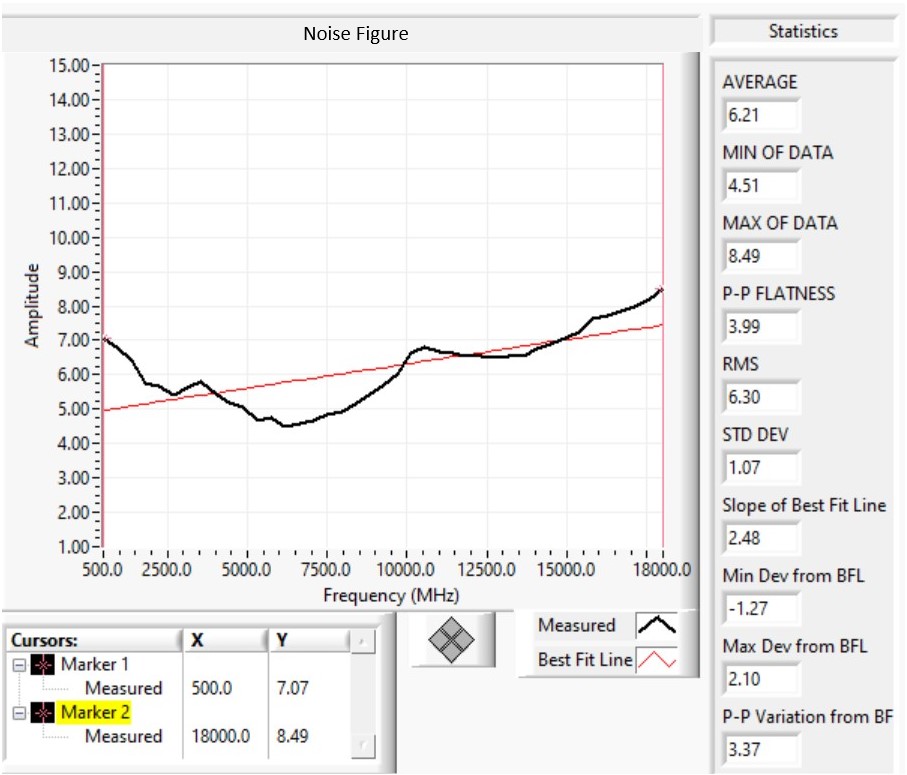
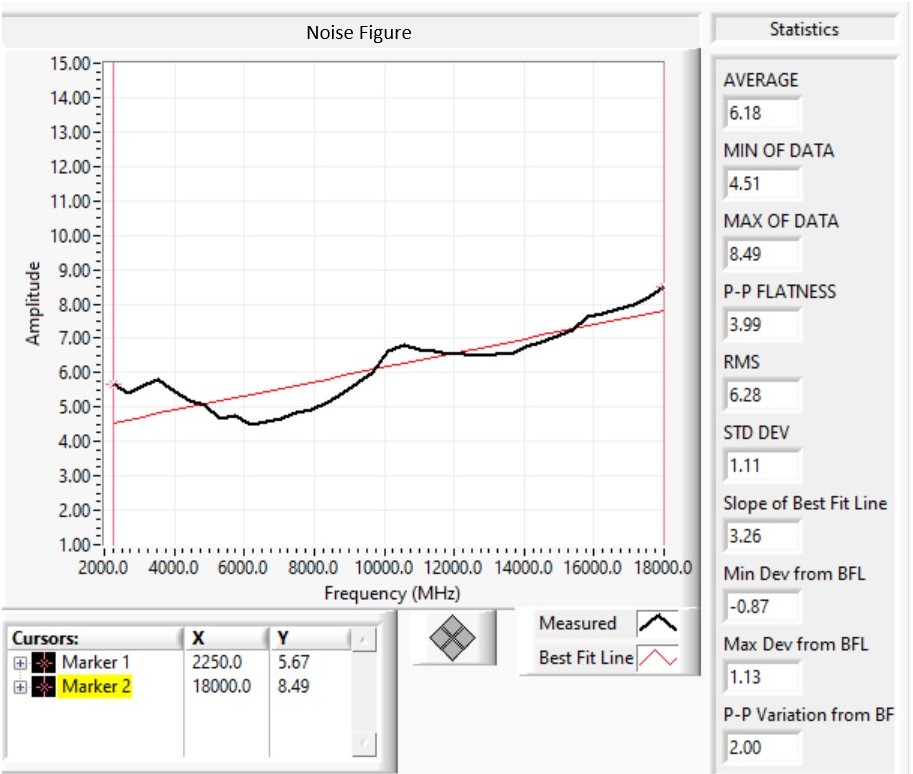
Typical Gain and Noise Figure across the DAA's working band can be seen below.
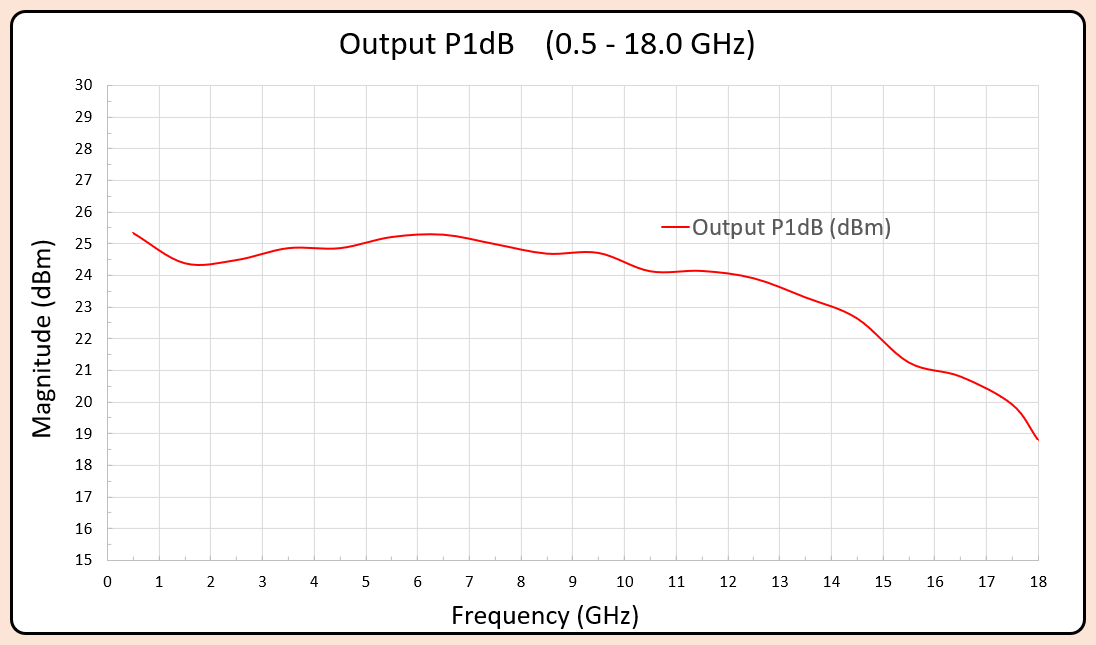
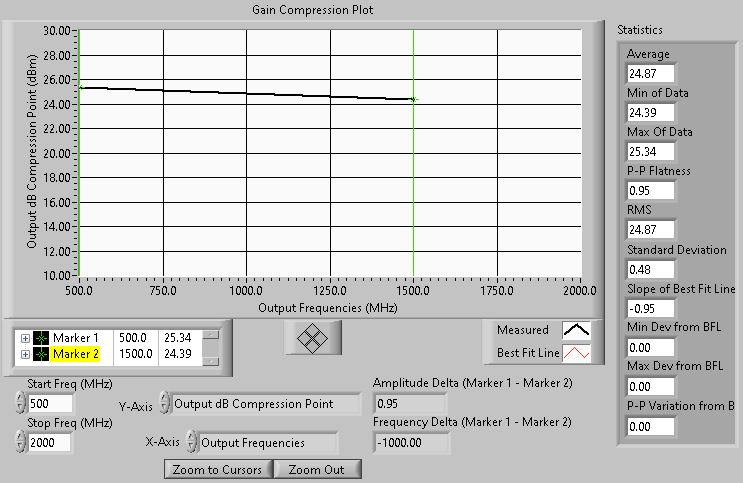
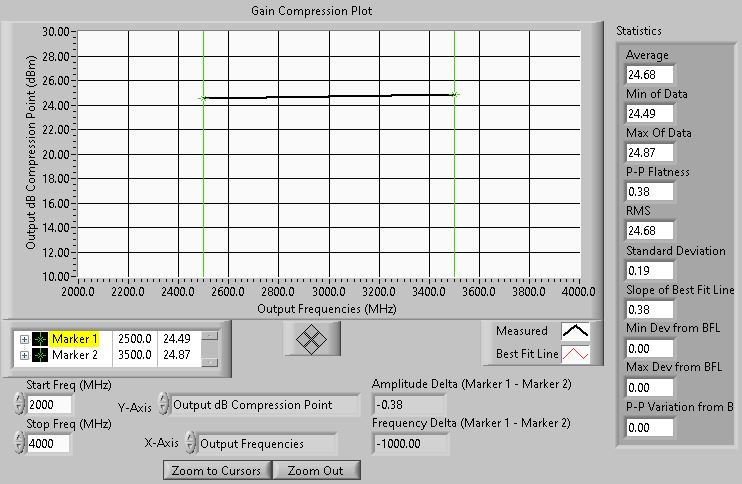
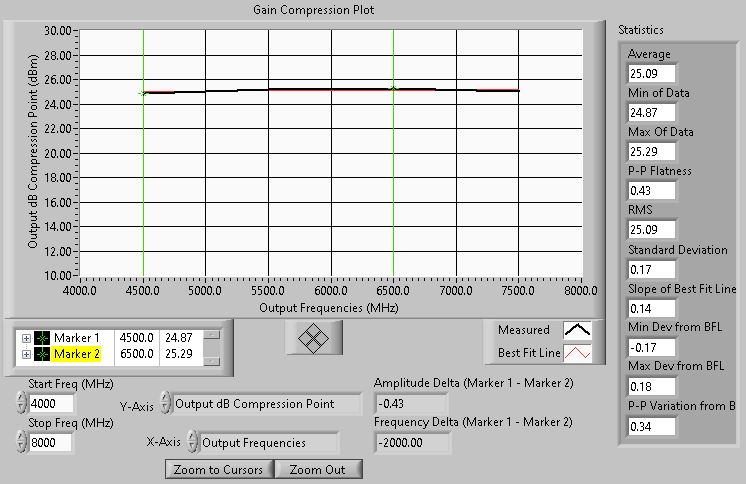
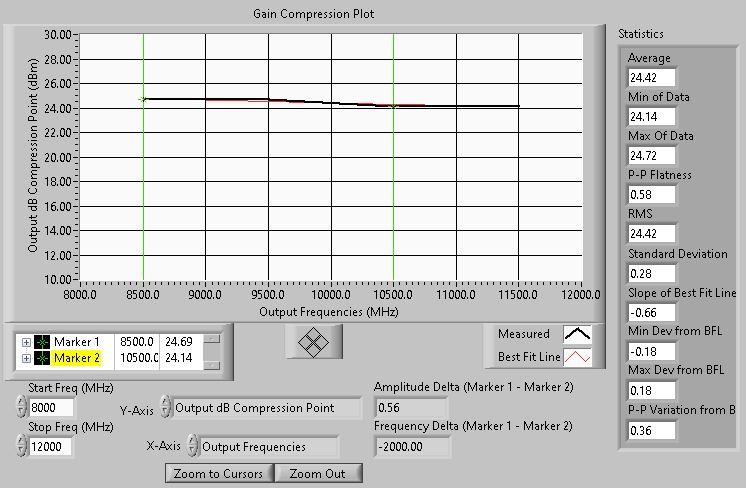
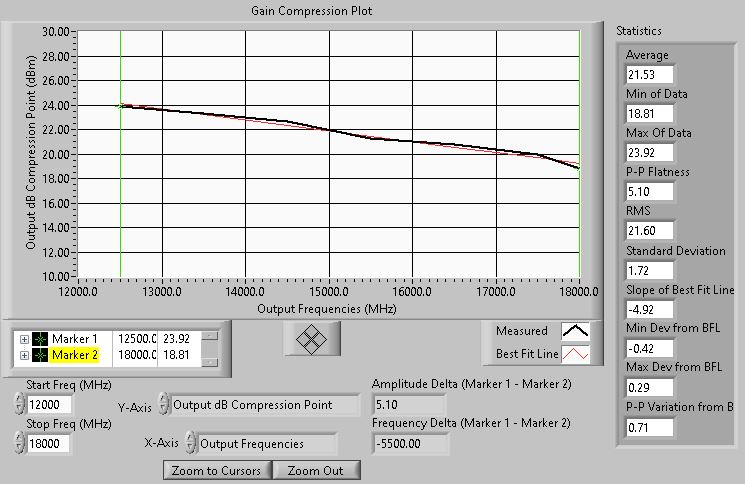
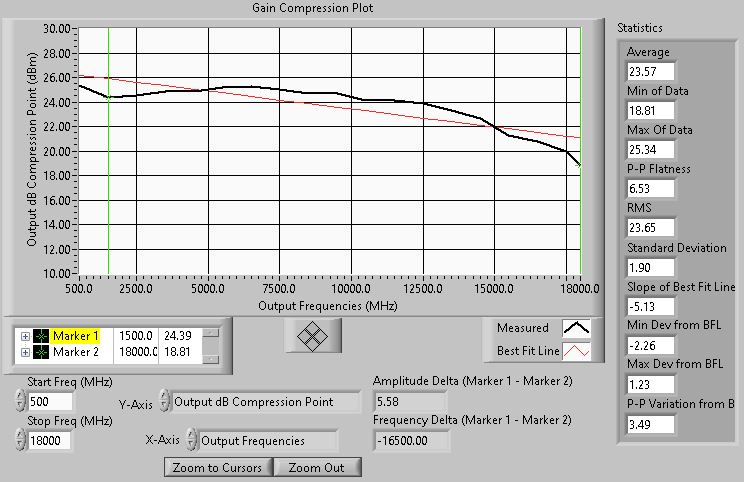
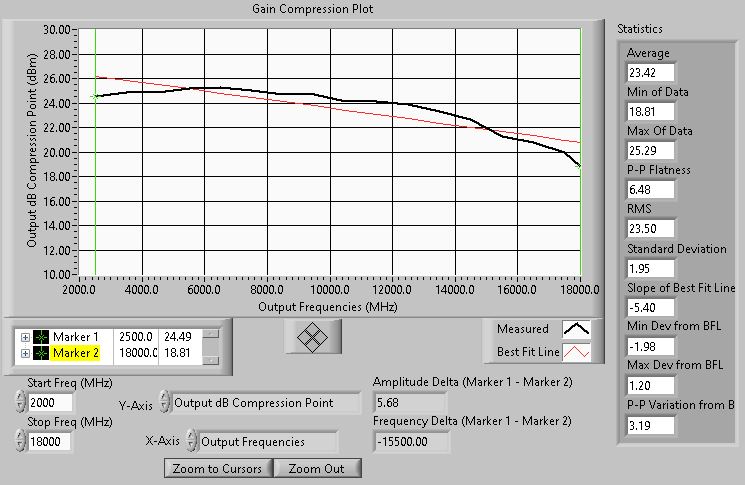
Typical output 1dB compression points across the unit's working band are plotted below.
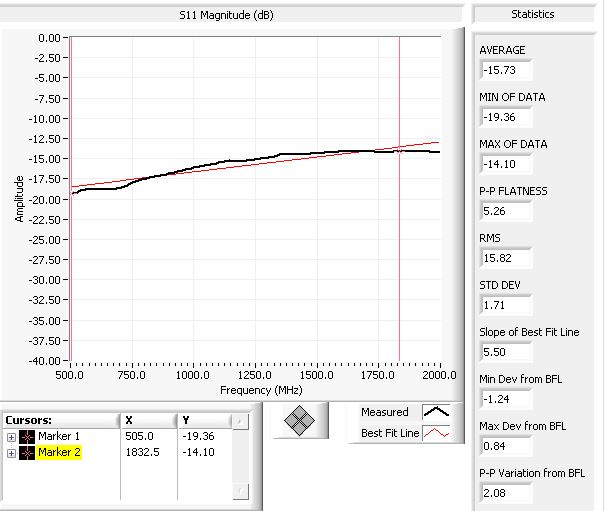
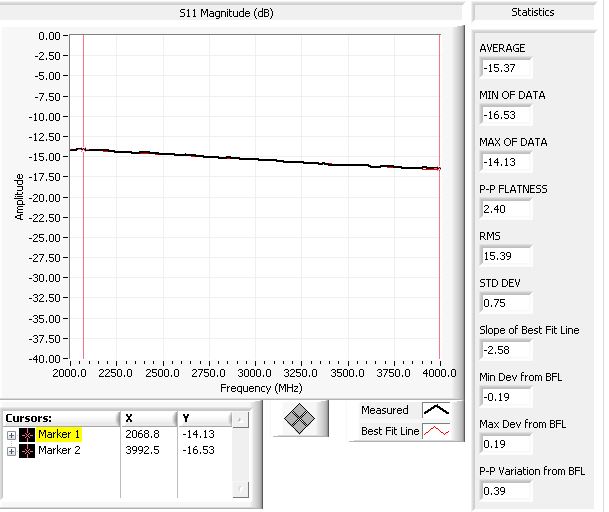
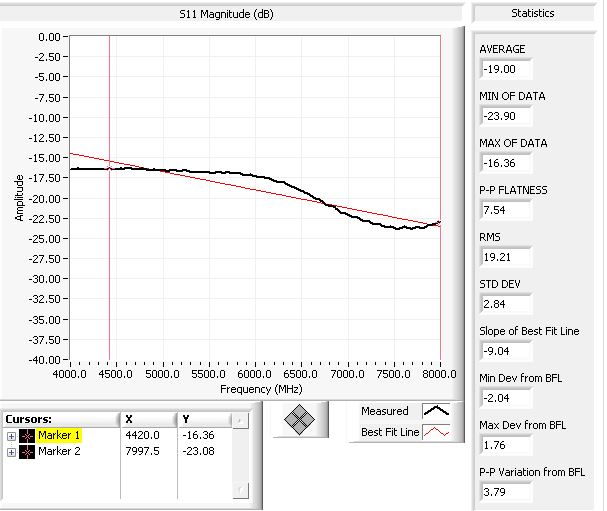
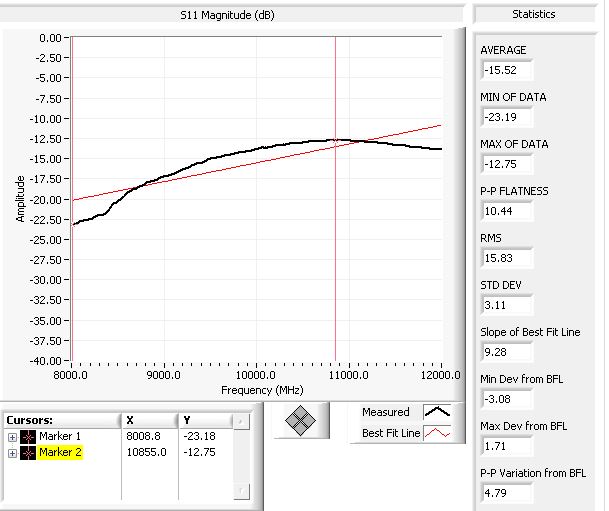
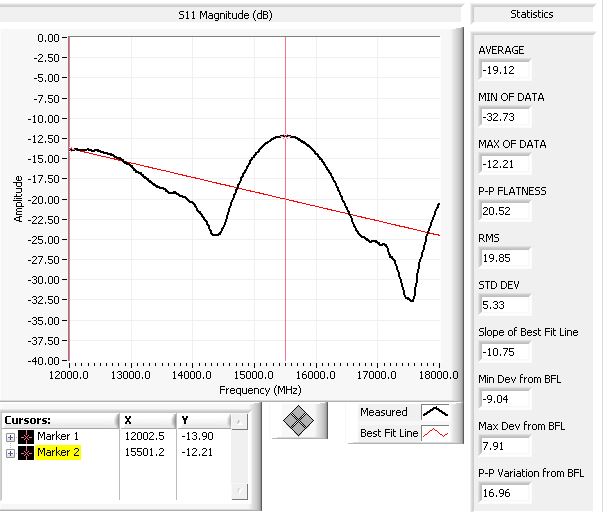
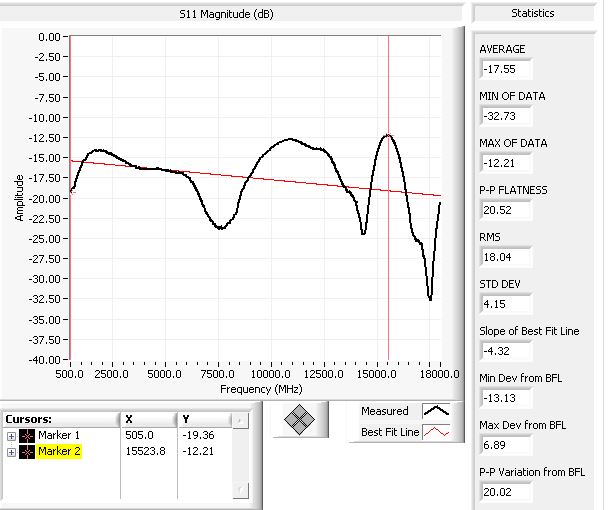
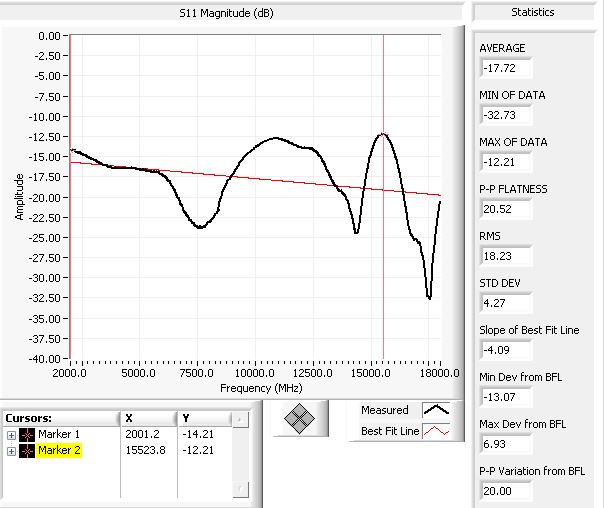
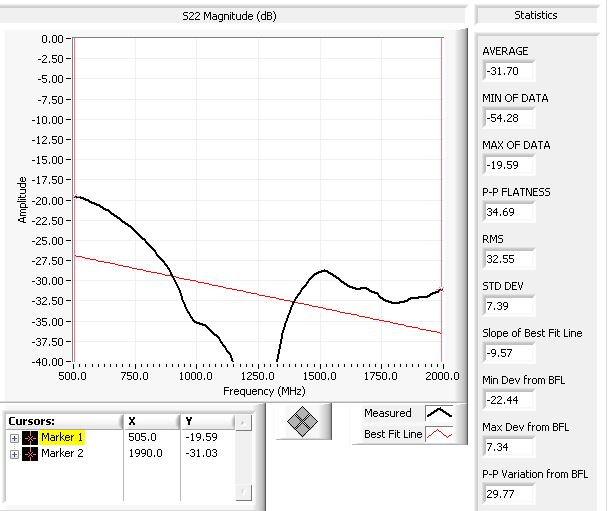
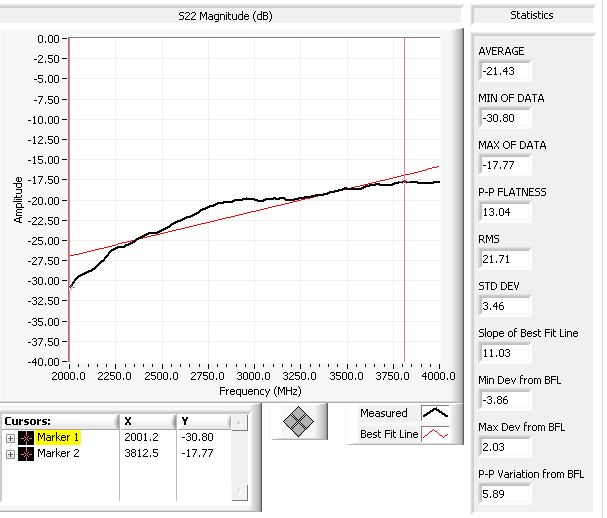
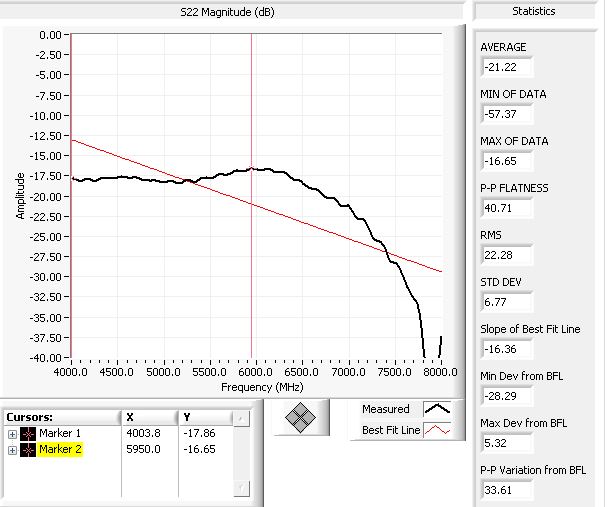
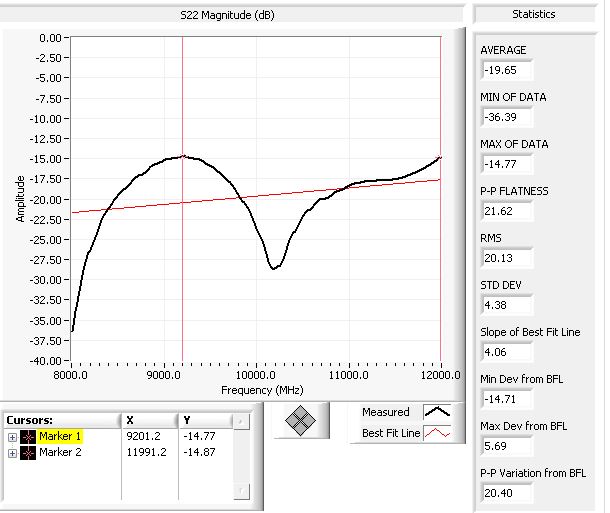
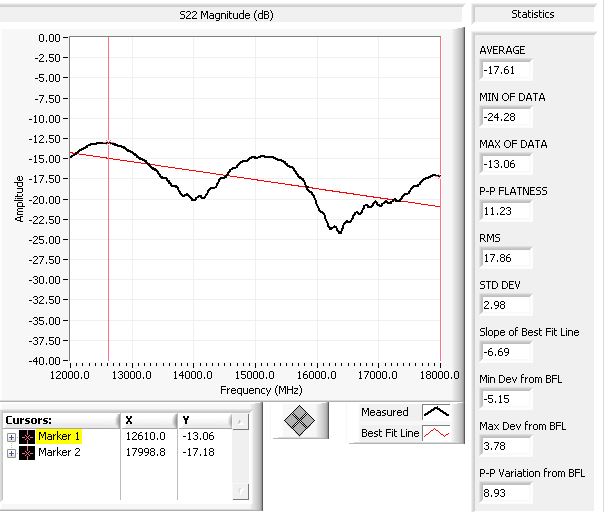
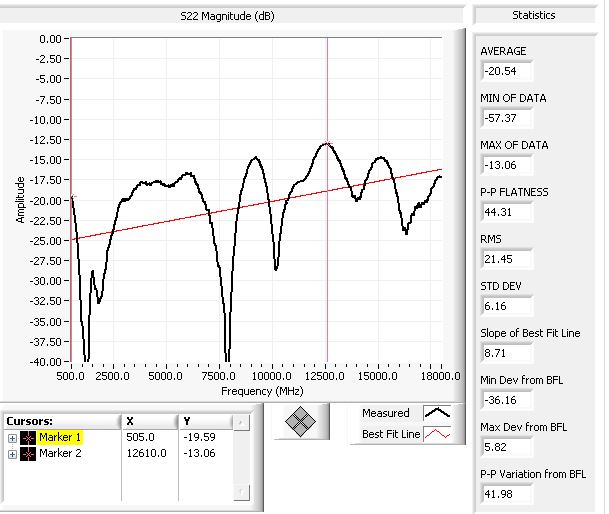
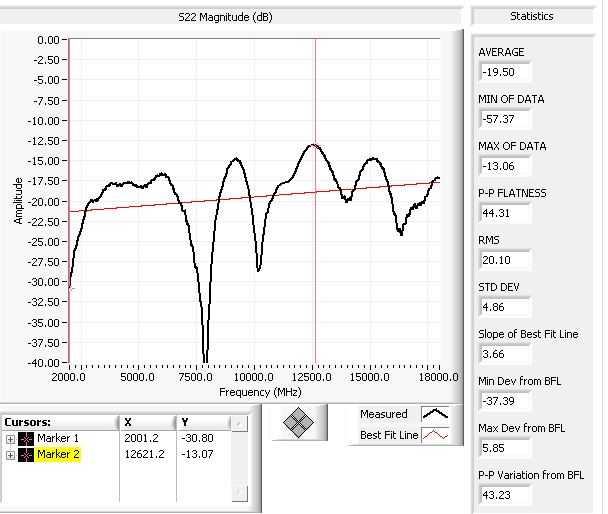
Typical input and output return loss across the frequency band can be seen below. The plot displays typical and maximum dB values, plotted as solid red and dotted blue lines. Also, the maximum VSWR ratio for S11 and S22 can be observed, plotted as solid green and dashed gold lines. Refer to the key within the plot below to aid with identification as well.

The table below shows typical, and worst case data for the DAA. The data below also shows the unit's performance in its reference state, providing LVTTL logic HIGH to pins D0-D3. Input and output return loss (S11 and S22) values are representative of the maximum values over the various frequency bands. The P1dB value is representative of the minimum value over the various frequency ranges, and is associated with the output. Peak to peak (P-P) value is the difference, in decibels, between the positive and negative peak of the measured gain value. "NF" refers to the noise figure maximum for each respective band. Links show typical data plots.
| Frequency Range (GHz) | |||||||||
| Specification | 0.5 - 2.0 | 2.0 - 4.0 | 4.0 - 8.0 | 8.0 - 12.0 | 12.0 - 18.0 | 0.5 - 18.0 | 2.0 - 18.0 | ||
| GainAvg. (dB) | Minimum | 17.4 | 17.1 | 16.1 | 16.1 | 15.7 | 16.2 | 16.1 | |
| Typical | 17.5 | 17.2 | 16.4 | 16.5 | 16.3 | 16.6 | 16.5 | ||
| Maximum | 18.0 | 17.7 | 16.9 | 16.9 | 16.8 | 17.1 | 17.0 | ||
| P-P Flatness (dB) | -- | -- | -- | -- | -- | -- | -- | -- | |
| Typical | 0.9 | 0.7 | 0.7 | 0.8 | 0.9 | 2.3 | 1.8 | ||
| Maximum | 1.0 | 0.8 | 1.0 | 0.9 | 1.9 | 3.6 | 2.9 | ||
| P1dBMin. (dBm) | Minimum | 23.1 | 23.6 | 23.3 | 21.7 | 17.6 | 17.6 | 17.6 | |
| Typical | 24.4 | 24.5 | 24.8 | 24.1 | 18.8 | 18.8 | 18.8 | ||
| -- | -- | -- | -- | -- | -- | -- | -- | ||
| S11Max. (dB) [VSWR] | -- | -- | -- | -- | -- | -- | -- | -- | |
| Typical | -14.1 | -14.1 | -16.4 | -12.7 | -12.2 | -12.2 | -12.2 | ||
| Maximum | -10.2 [1.9:1] | -10.2 [1.9:1] | -10.2 [1.9:1] | -9.5 [2.0:1] | -9.5 [2.0:1] | -9.5 [2.0:1] | -9.5 [2.0:1] | ||
| S22Max. (dB) [VSWR] | -- | -- | -- | -- | -- | -- | -- | -- | |
| Typical | -19.6 | -17.7 | -16.6 | -14.7 | -13.0 | -13.0 | -13.0 | ||
| Maximum | -11.7 [1.7:1] | -11.7 [1.7:1] | -11.7 [1.7:1] | -9.5 [2.0:1] | -9.5 [2.0:1] | -9.5 [2.0:1] | -9.5 [2.0:1] | ||
| NFMax. (dB) | -- | -- | -- | -- | -- | -- | -- | -- | |
| Typical | 7.3 | 5.5 | 5.2 | 6.3 | 8.4 | 8.4 | 8.4 | ||
| Maximum | 8.0 | 6.5 | 6.5 | 7.5 | 9.5 | 9.5 | 9.5 | ||
*All data taken at ambient temperature unless otherwise specified*
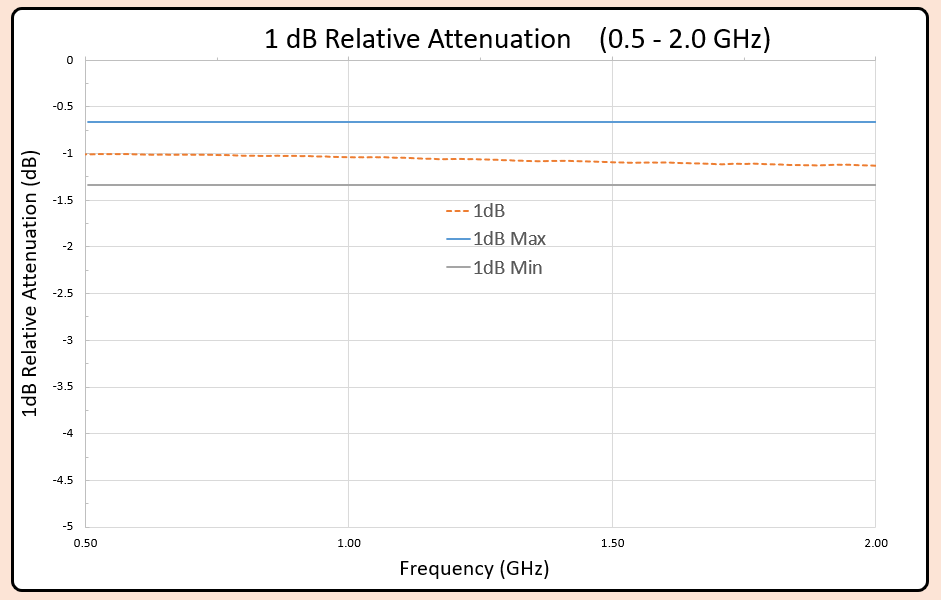
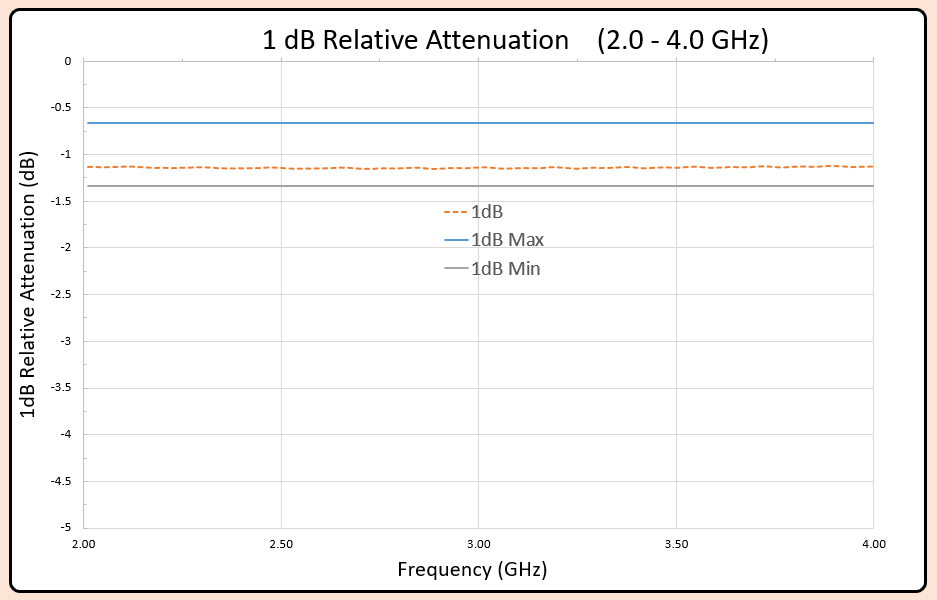
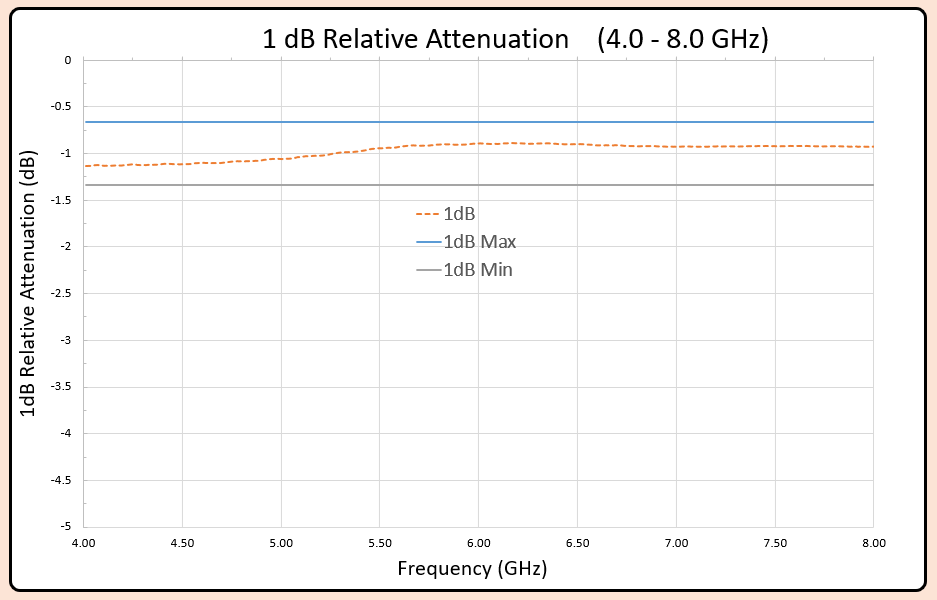
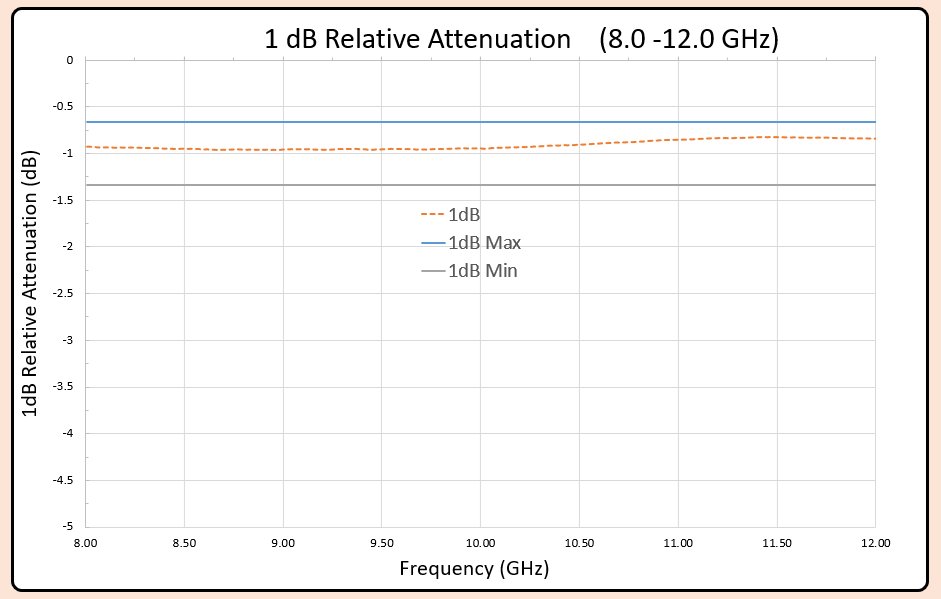
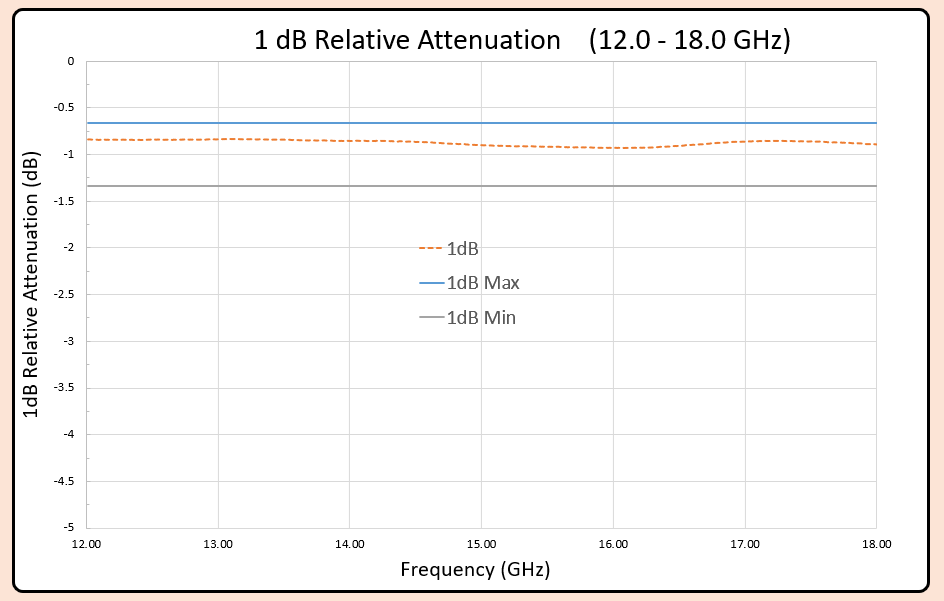
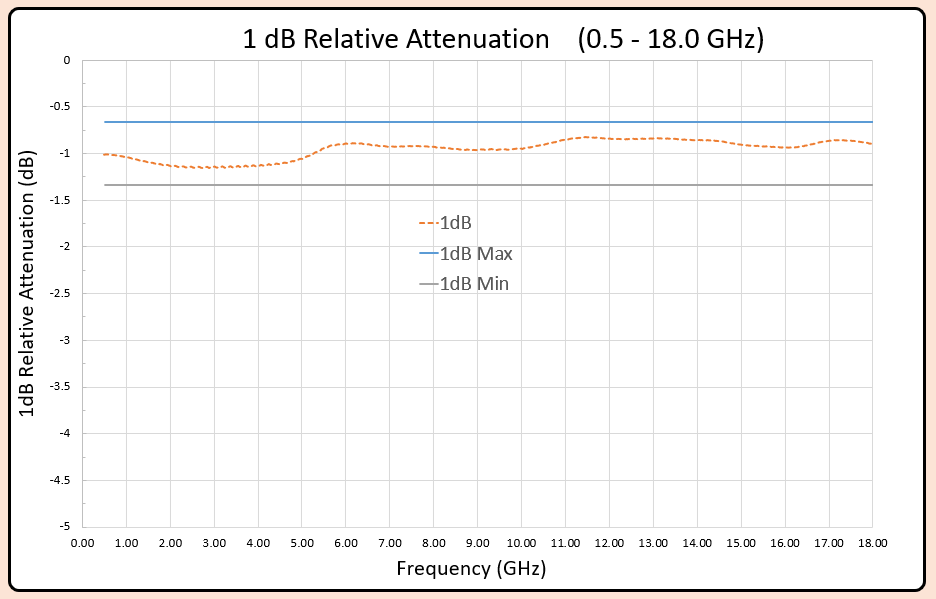
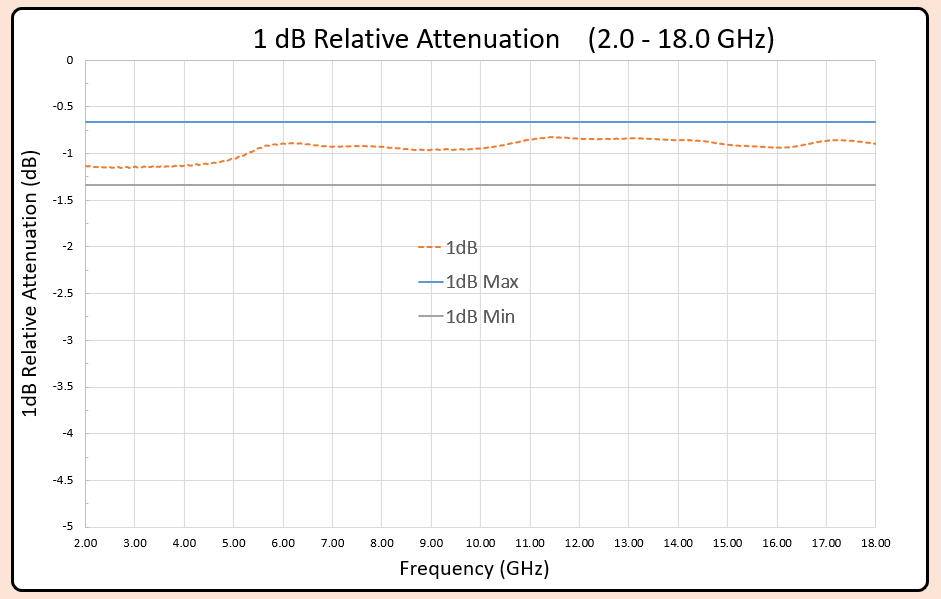
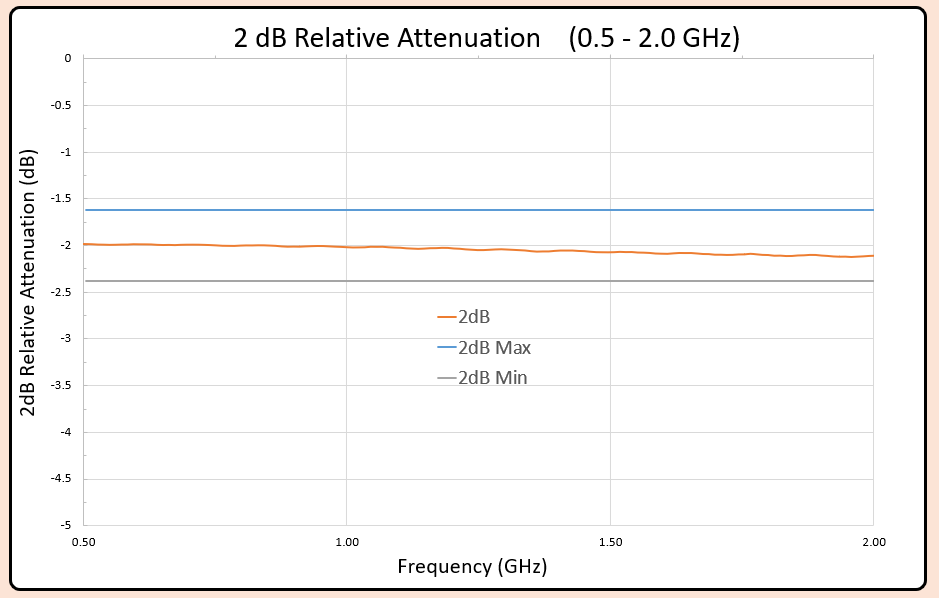
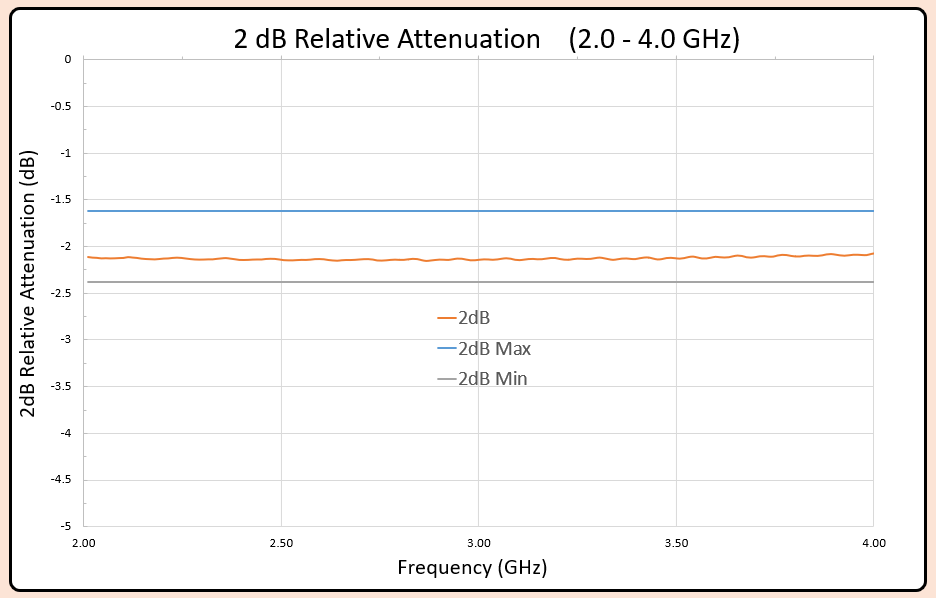
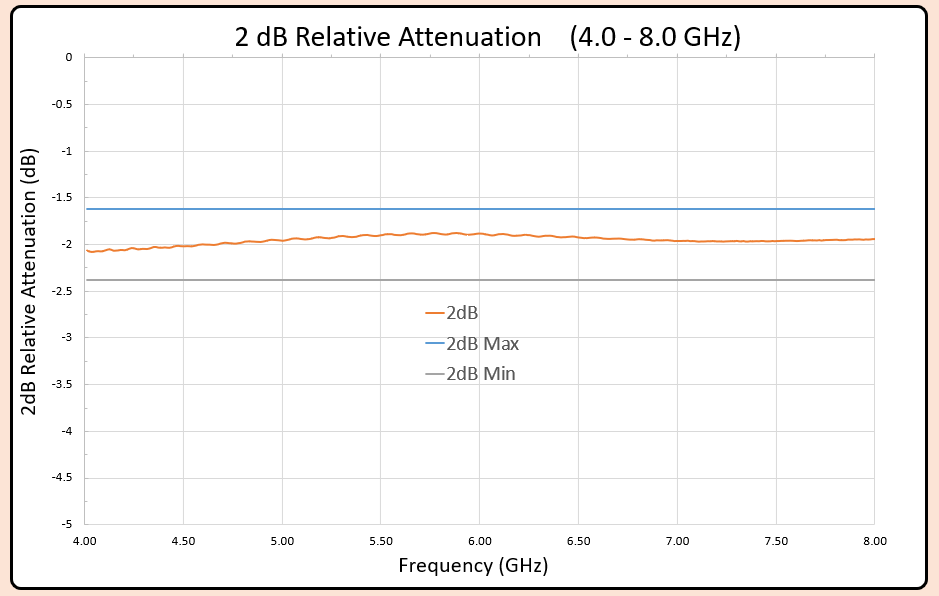
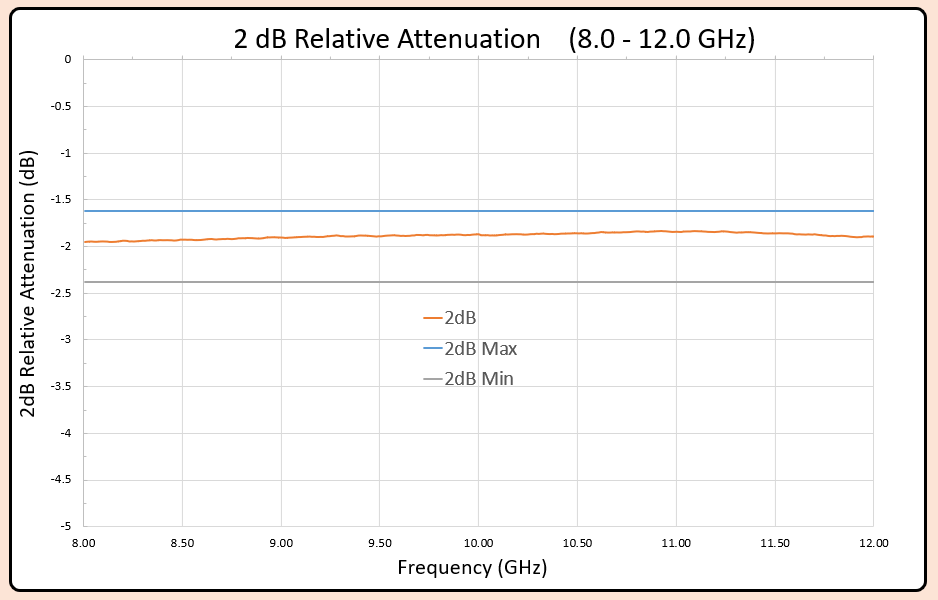
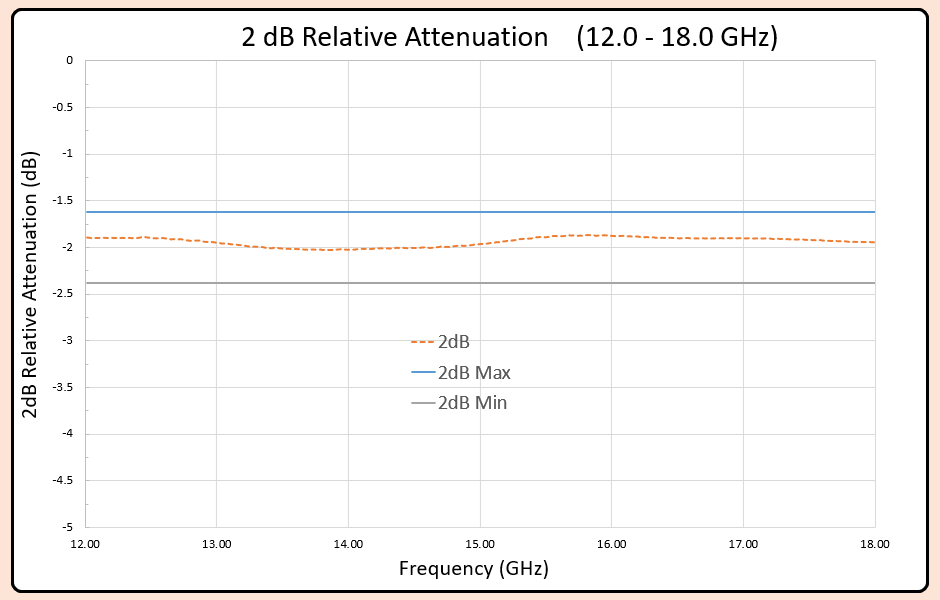
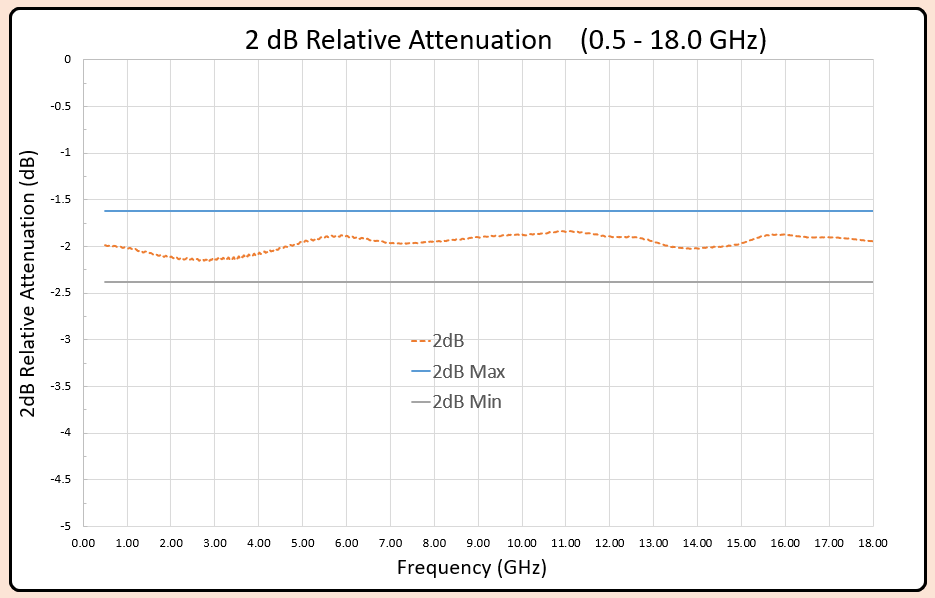
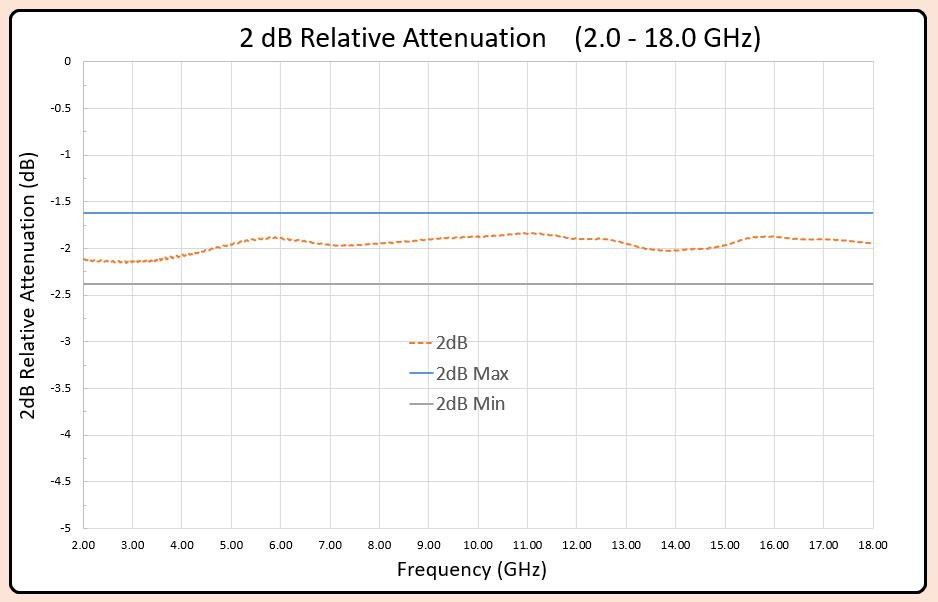
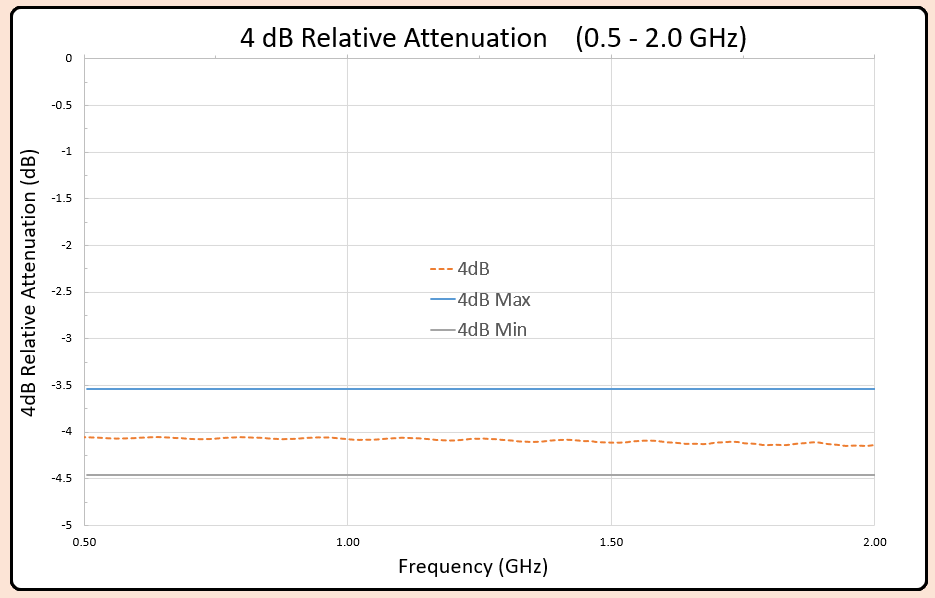
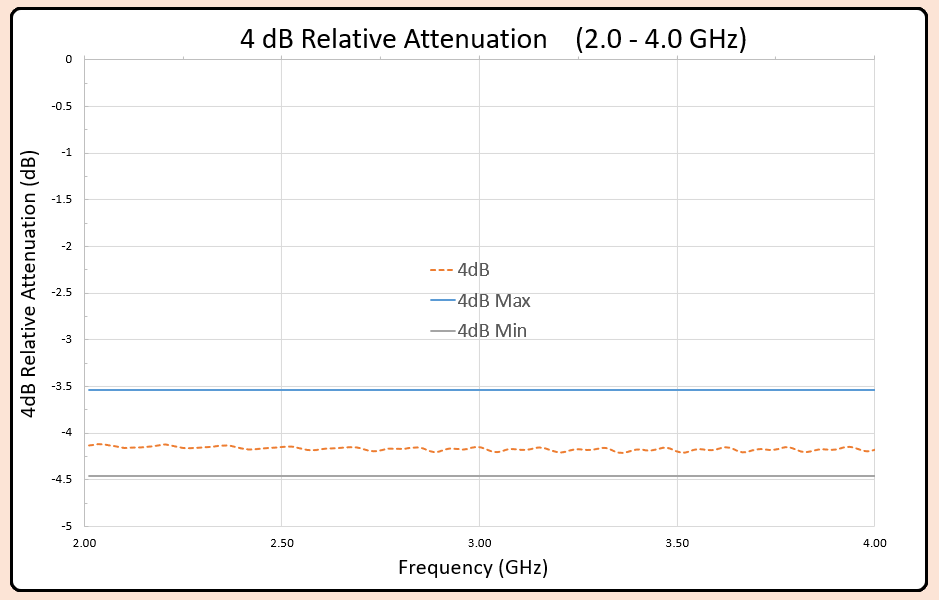
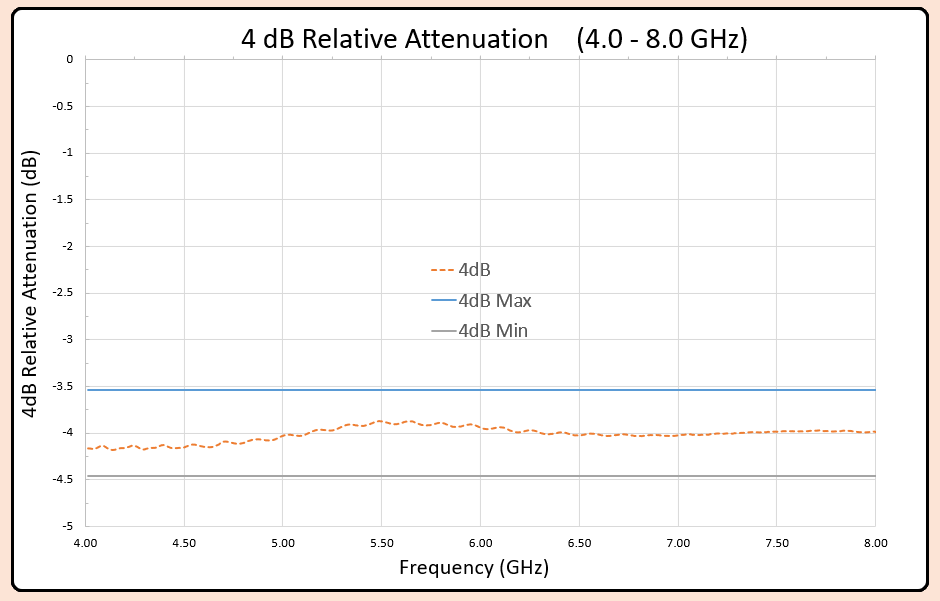
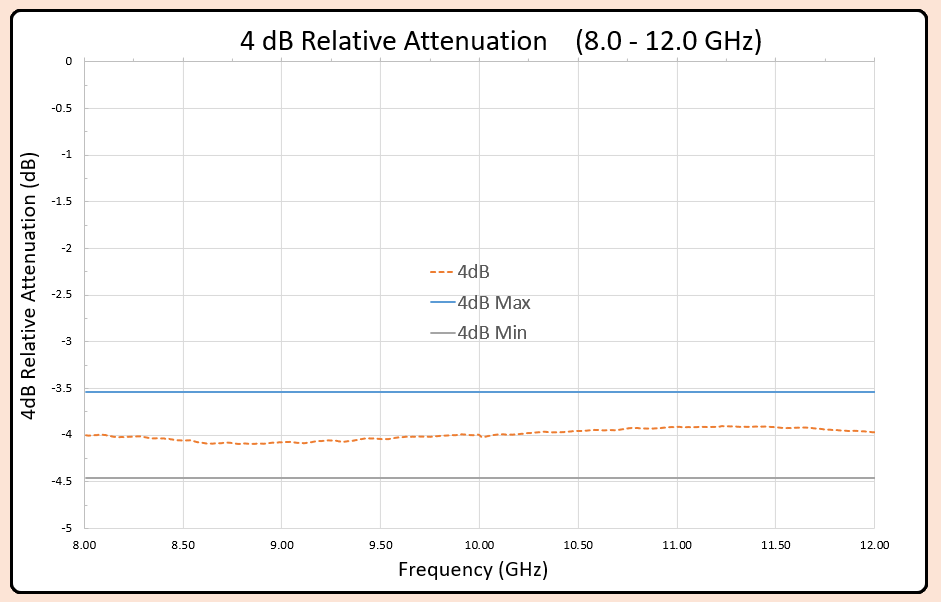
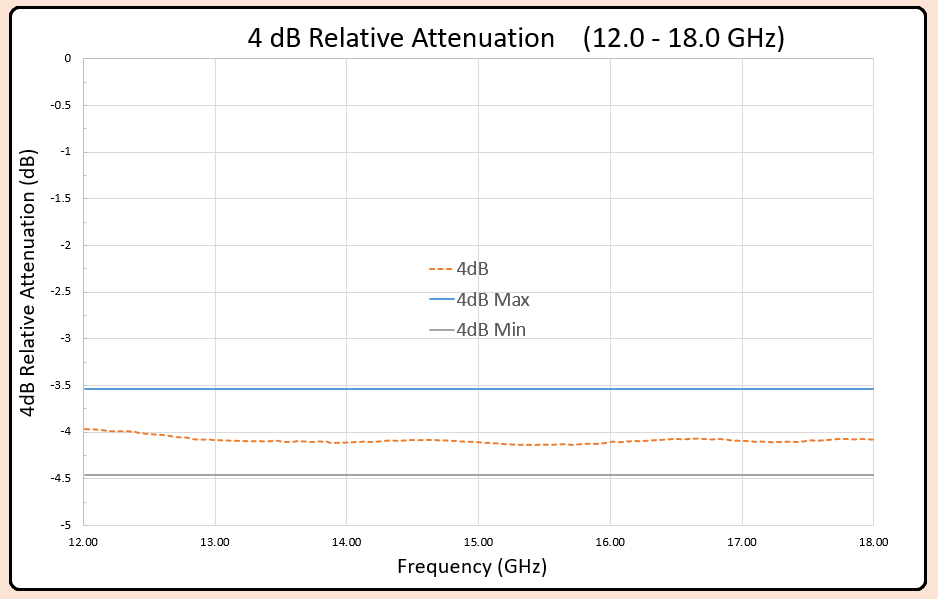
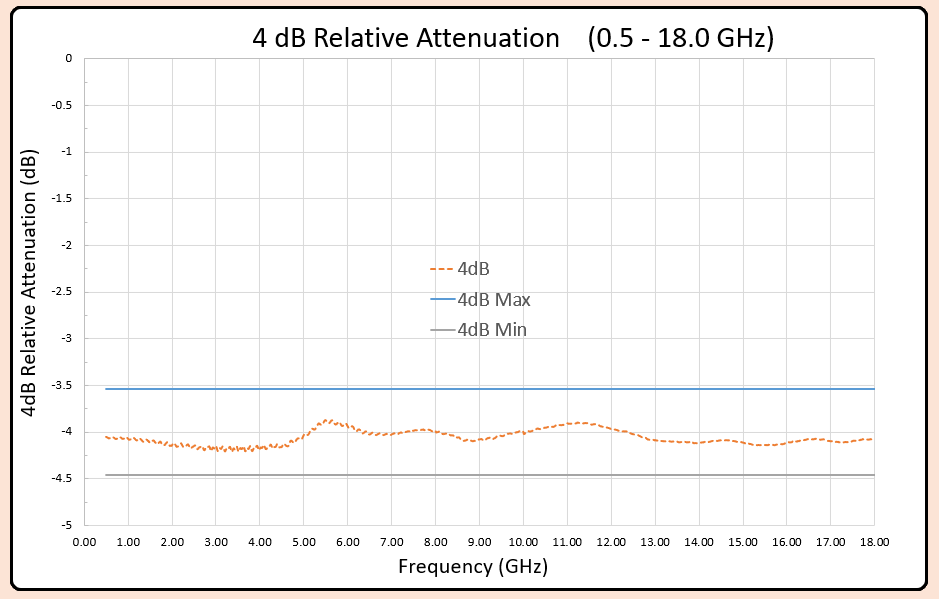
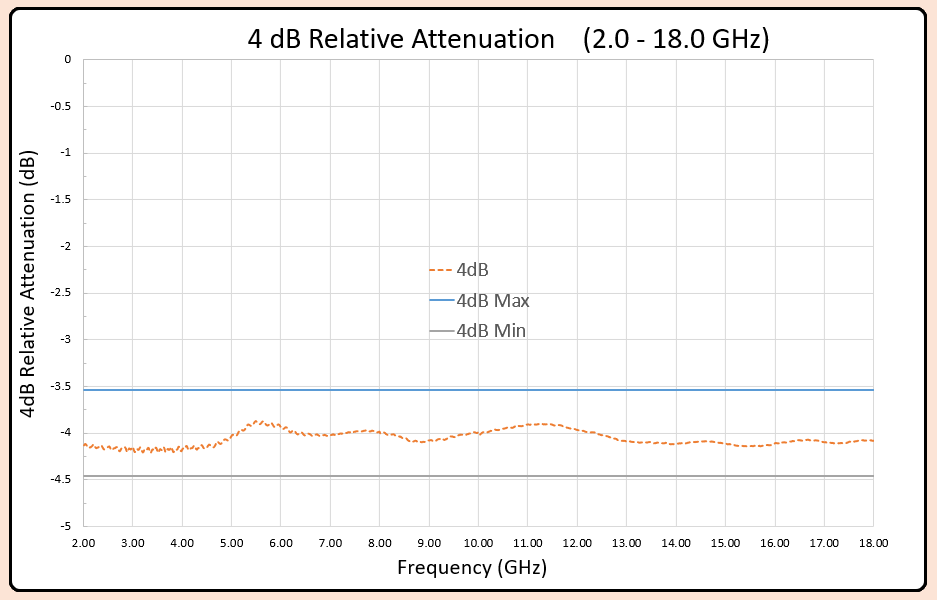
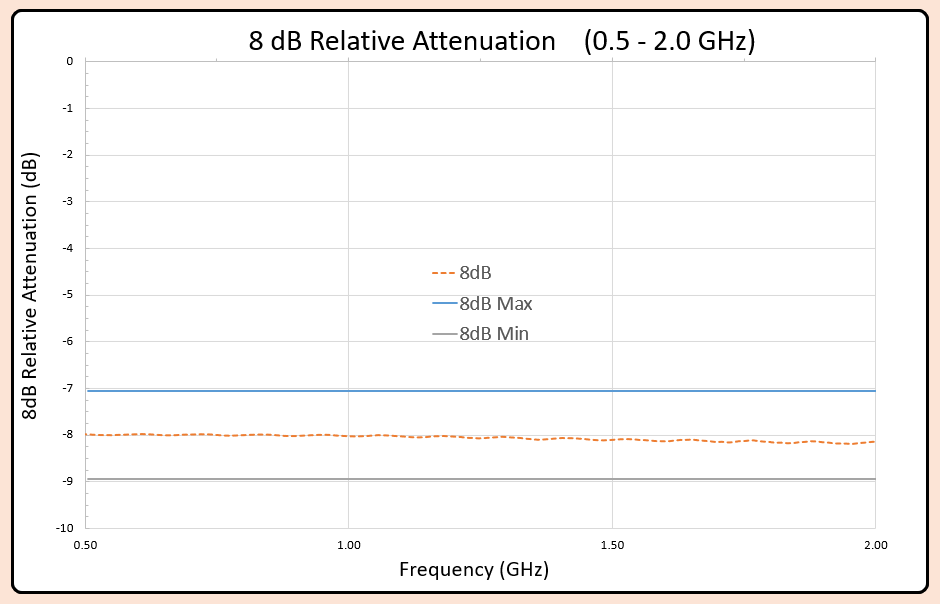
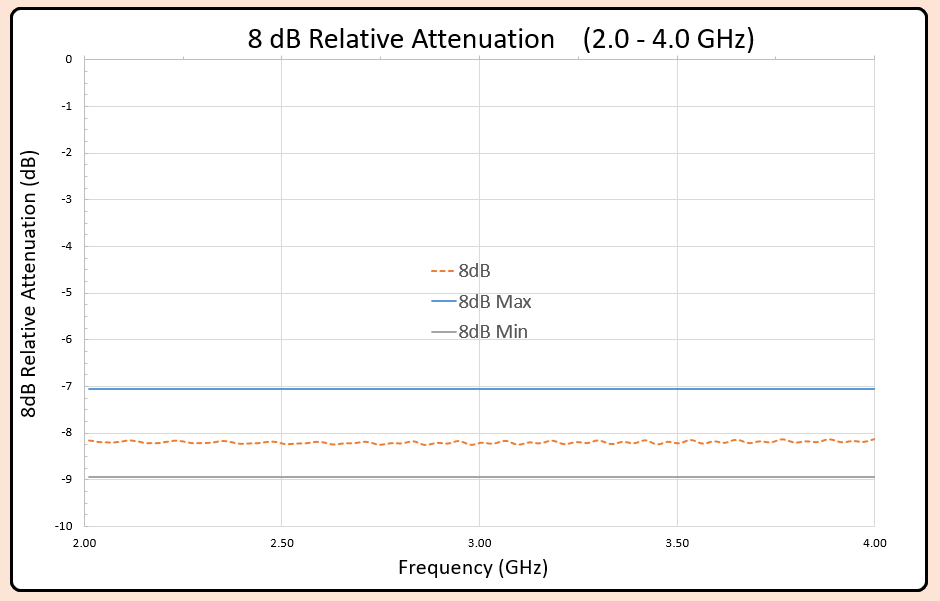
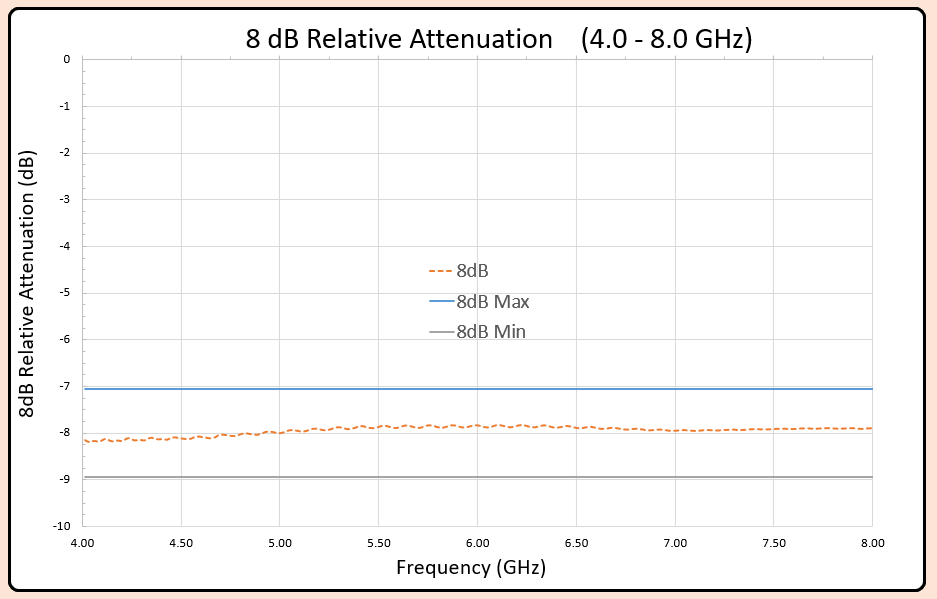
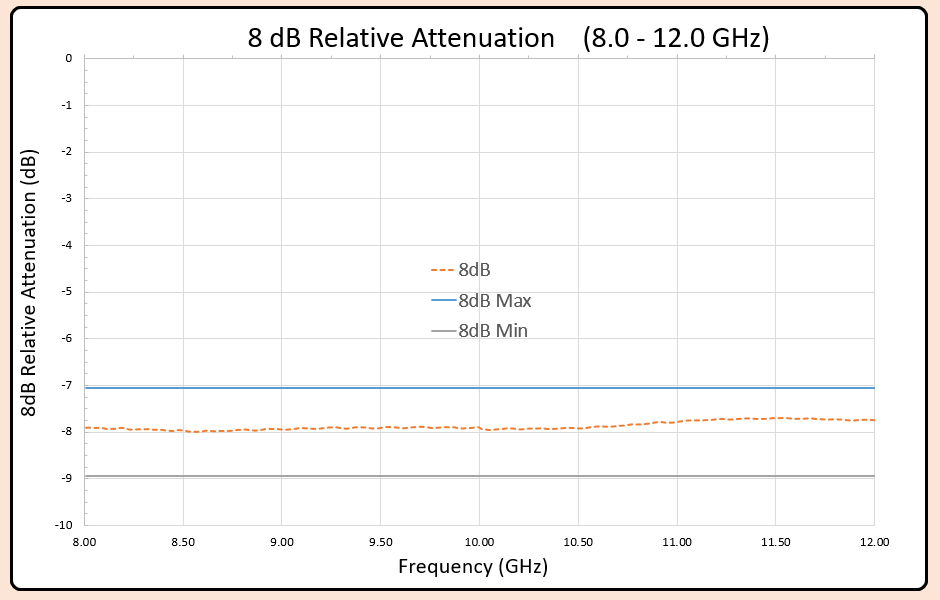
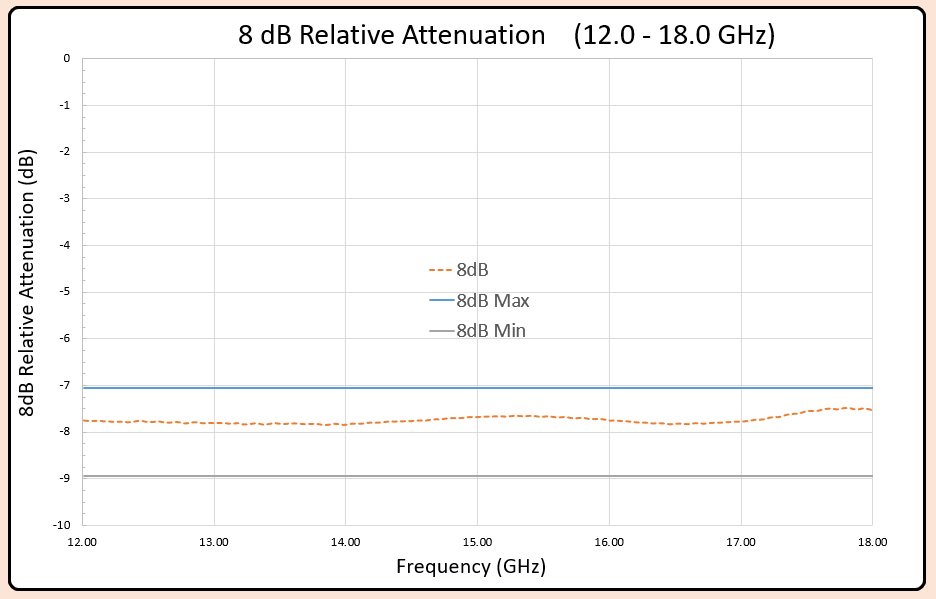
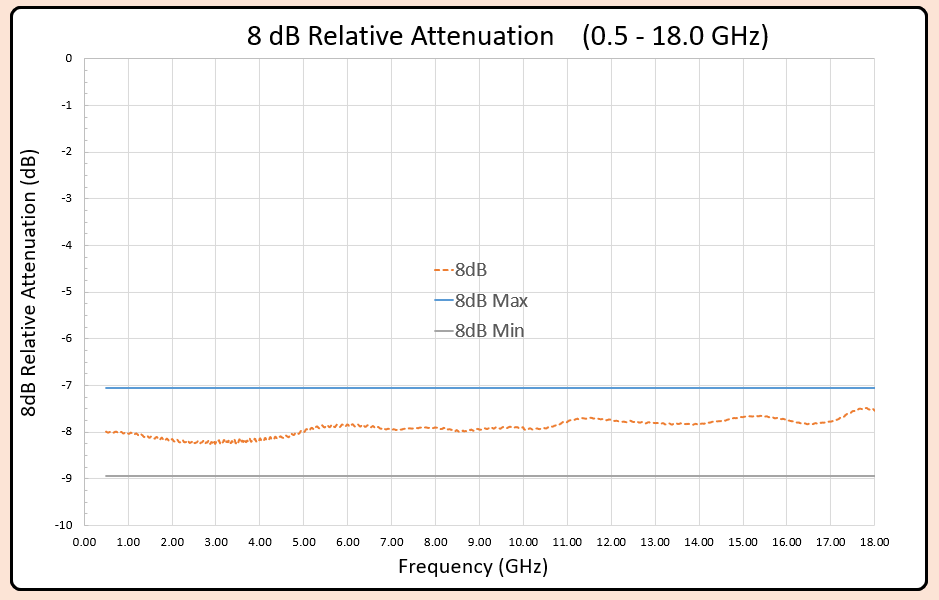
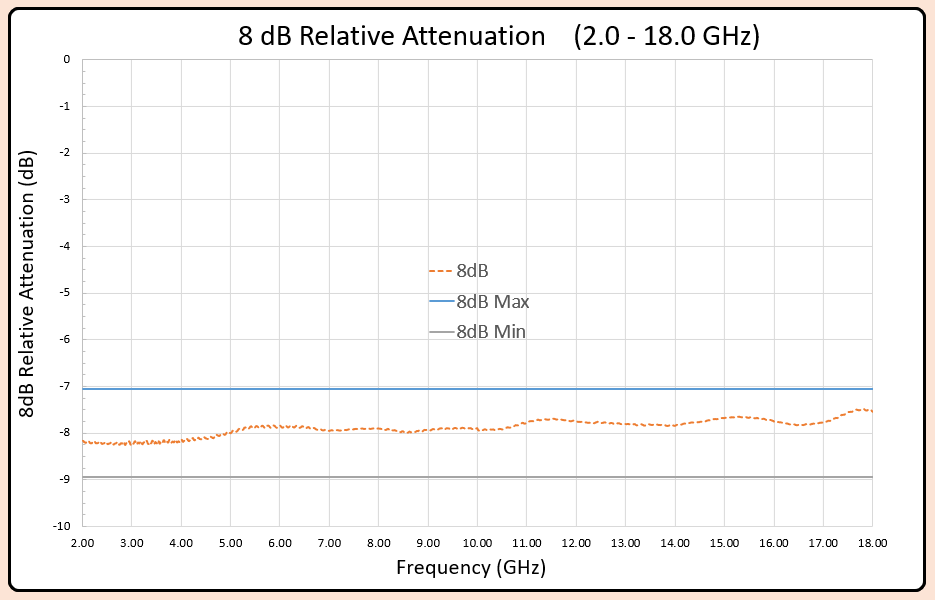
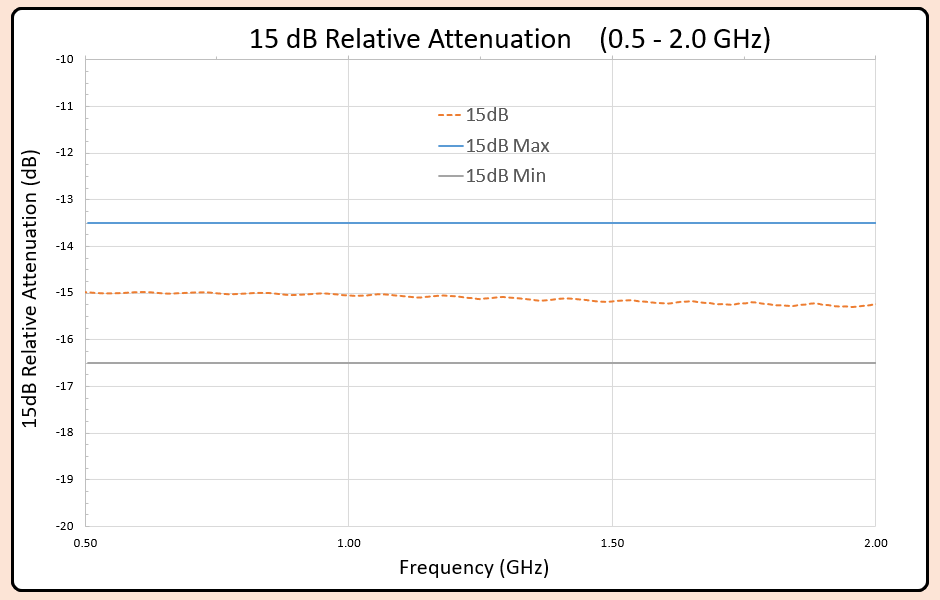
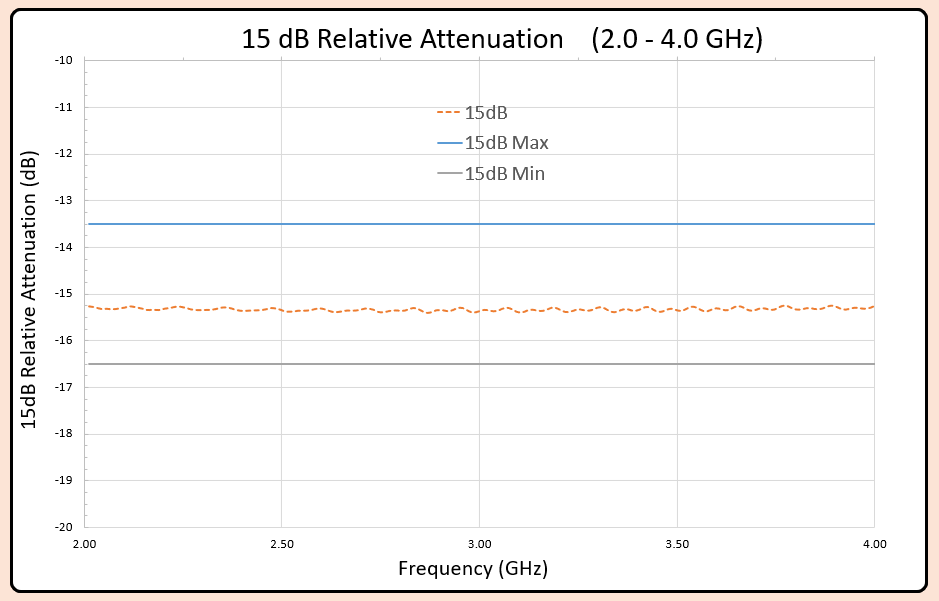
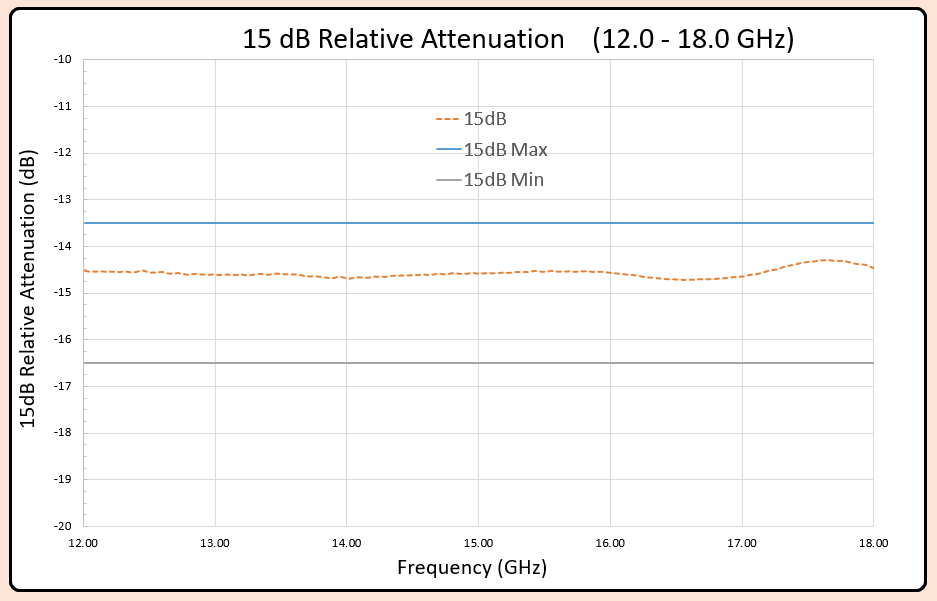
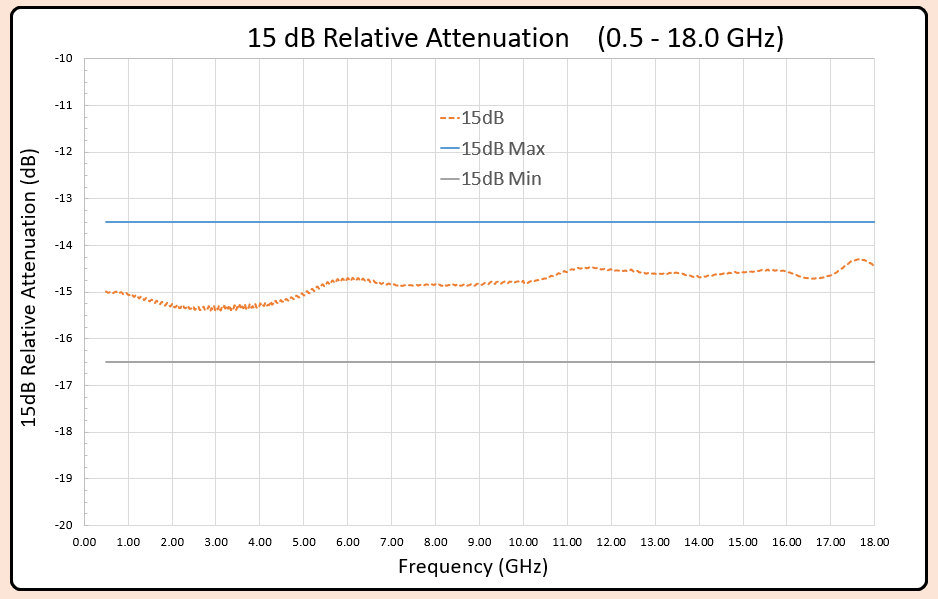
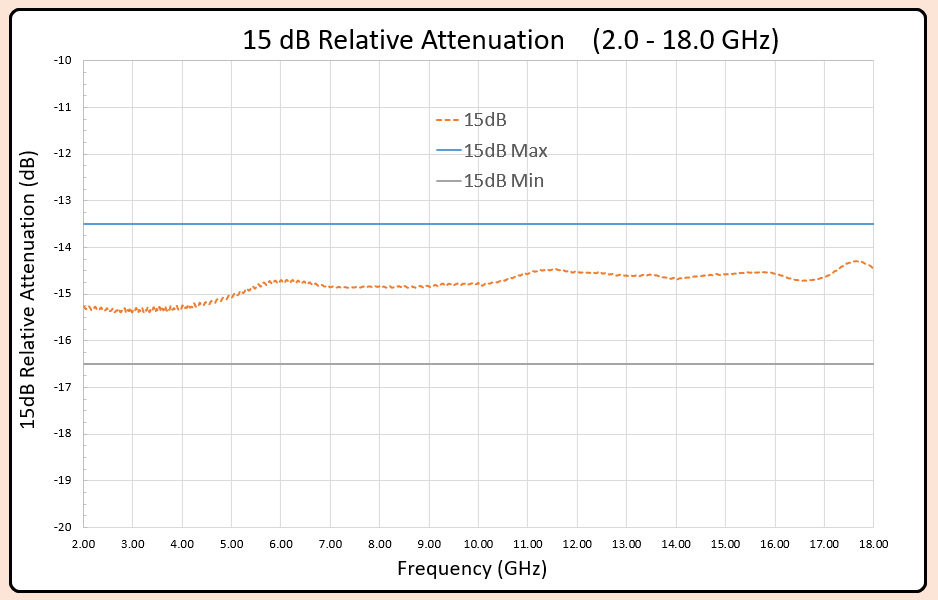
Typical Relative Attenuation across the DAA's working band can be seen below.
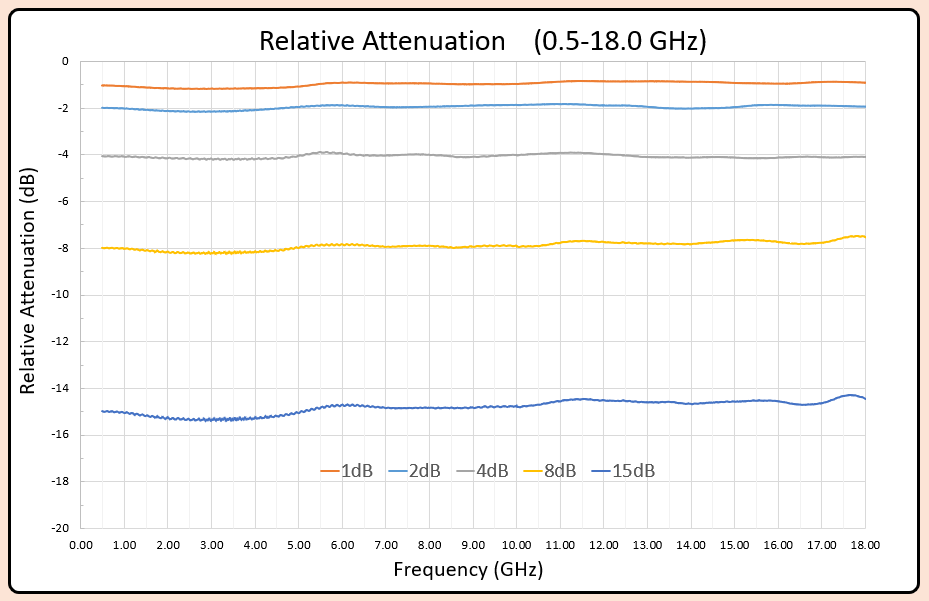
The digital attenuation functionality of this unit is done via TTL or LVTTL logic. Control is done by providing a positive voltage to any or all of the four control pins. See our Truth Table below for more detail. We ensure the product's various digital attenuation states meet a window of accuracy acceptable to its current applications. For attenuation states less than 7dB, we expect a maximum value of 0.3 + 4% of the desired attenuation setting. For states greater than 7dB, we expect a maximum value of 0.3 + 8% of the desired attenuation setting.
Relative values are calculated point by point across the band, taking the reference state data and comparing it to the selected attenuation state. For example, with the 2dB attenuation state selected, we ensure the unit has a gain level within 0.40dB of the expected attenuation level. Additionally, if we have 16dB gain in the reference state, we expect the unit to output 14dB gain levels across its working frequency band in the 2dB attenuation state.
Testing of these units involves recording the absolute maximum of gain values in the selected attenuation state versus the reference state (0dB). The data presented in the table shows typical and worst case values of the various attenuation states the DAA offers. Selecting any of the links within the typical rows will load the appropriate plot. Each plot shows typical data across the desired band, along with maximum and minimum possible values to expect for each attenuation setting.
| Frequency Range (GHz) | |||||||||
| Relative Attenuation | 0.5 - 2.0 | 2.0 - 4.0 | 4.0 - 8.0 | 8.0 - 12.0 | 12.0 - 18.0 | 0.5 - 18.0 | 2.0 - 18.0 | ||
| 1 dB | Typical | 0.10 | 0.15 | 0.10 | 0.10 | 0.15 | 0.10 | 0.10 | |
| Maximum | 0.35 | 0.35 | 0.35 | 0.35 | 0.35 | 0.35 | 0.35 | ||
| 2 dB | Typical | 0.10 | 0.15 | 0.10 | 0.10 | 0.10 | 0.10 | 0.10 | |
| Maximum | 0.40 | 0.40 | 0.40 | 0.40 | 0.40 | 0.40 | 0.40 | ||
| 4 dB | Typical | 0.10 | 0.20 | 0.10 | 0.10 | 0.10 | 0.10 | 0.10 | |
| Maximum | 0.50 | 0.50 | 0.50 | 0.50 | 0.50 | 0.50 | 0.50 | ||
| 8 dB | Typical | 0.10 | 0.20 | 0.10 | 0.25 | 0.30 | 0.10 | 0.15 | |
| Maximum | 1.0 | 1.0 | 1.0 | 1.0 | 1.0 | 1.0 | 1.0 | ||
| 15 dB | Typical | 0.15 | 0.35 | 0.10 | 0.40 | 0.45 | 0.20 | 0.25 | |
| Maximum | 1.50 | 1.50 | 1.50 | 1.50 | 1.50 | 1.50 | 1.50 | ||
*All data taken at ambient temperature unless otherwise specified*
| Absolute Maximum Ratings | |
|---|---|
| Positive Voltage (+V) | +13V |
| Negative Voltage (-V) | -13V |
| Control Voltage (Any Pin) | +5.5V |
| RF Input Power | +25dBm |
| ESD Sensitivity (HBM) | Class 1A |
| Operating Temperature | -40 to 85°C |
| Storage Temperature | -55 to 150°C |
| *Exceeding any one or combination of the following maximum ratings may cause permanent damage to the device* | |
| Recommended Operating Conditions | |
|---|---|
| Positive Voltage (+V) | +12V |
| Negative Voltage (-V) | -12V |
| Control Voltage, Low | 0 to 0.8V |
| Control Voltage, High | 2 to 5V |
| *Specifications are measured within these conditions. Performance is not guaranteed if altering one or any of these conditions.* | |
| Truth Table | ||||
|---|---|---|---|---|
| Control Voltage Input | Attenuation State | |||
| (D3) 8 dB |
(D2) 4 dB |
(D1) 2 dB |
(D0) 1 dB |
|
| 1 | 1 | 1 | 1 | Reference (0dB) |
| 1 | 1 | 1 | 0 | 1 dB |
| 1 | 1 | 0 | 1 | 2 dB |
| 1 | 0 | 1 | 1 | 4 dB |
| 0 | 1 | 1 | 1 | 8 dB |
| 0 | 0 | 0 | 0 | 15 dB |
| Any combination of states listed will provide attenuation approximately to the sum of the bits selected. | ||||
R. A. Wood Associates reserves the right to make minor modifications to limits if needed, to allow for producibility and manufacturing yields. In general, electrical performance improves as design improvements are learned and incoporated. If you would like to be notifed of limit changes, please Contact Us, and we will keep you informed. Please feel free to also browse our Other Products. Thank you for your time and consideration, we hope to hear from you soon!
![]()


©1995-2018 by R. A. Wood Associates